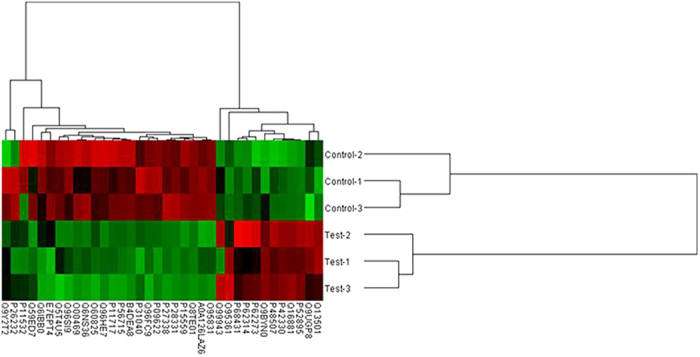
Figure 2. Hierarchical cluster of proteins differentially expressed between riboflavin deficient (test 1–3) and riboflavin adequate (control 1–3) samples with an FDR < 1% identified by MaxQuant.

Red, high expression; green, low expression. Two main clusters of proteins can be observed, one up-regulated (right) and other down-regulated (left) in riboflavin deficient group. Protein position in the cluster can be found in Table 1.
