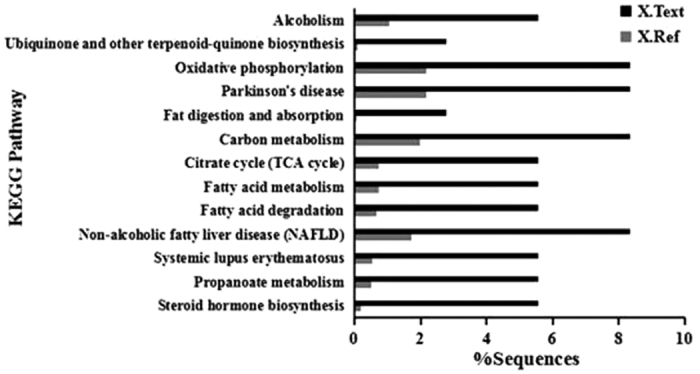
Figure 3. KEGG Pathway analysis.

KEGG pathway enrichment analyses were applied based on the Fisher’ exact test, considering the whole quantified protein/phosphorproteins annotation as background dataset. Benjamini- Hochberg correction for multiple testing was further applied to adjust derived p-values. Only pathways with p-values under a threshold of 0.05 were considered as significant.
