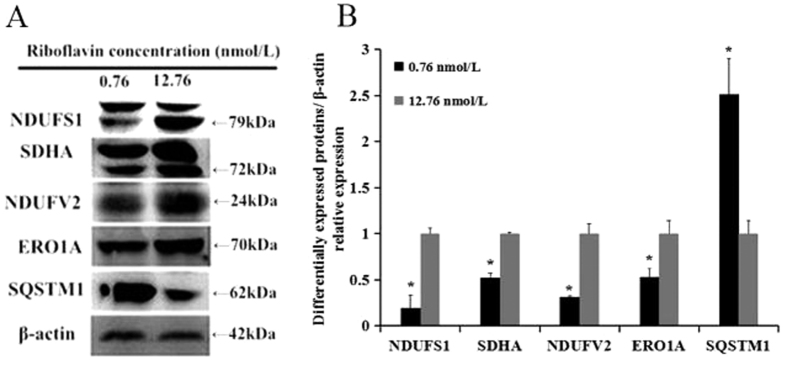
Figure 5. Immunoblotting validation of differentially expressed proteins.
(A) NDUFS1, SDHA, NDUFV2, ERO1A and SQSTM1 were selected to be validated by immunoblotting test (β-actin as the control). (B) quantification of immunoreactive band density measured in Panel A. Data are presented as the percent change relative to control (12.76 nmol/L) samples. The blots/gels were cropped and full-length blots/gels are presented in Supplementary Fig. S1. Data are presented as mean fold values ± SD of the changed expression at the protein level. *p < 0.01.

