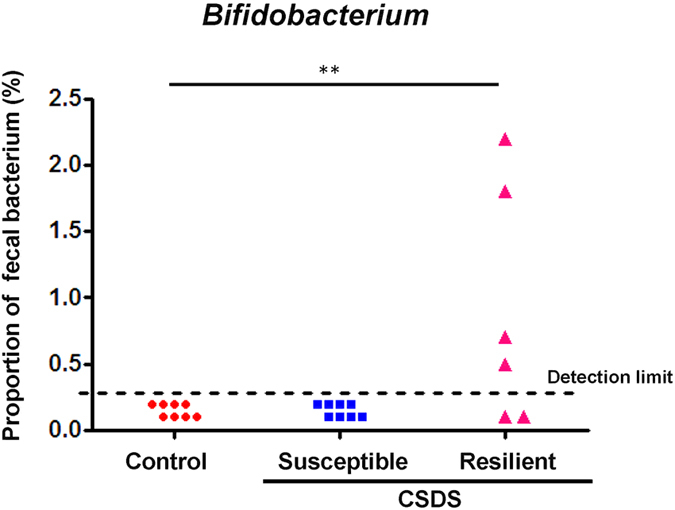
Figure 3. Fecal levels of Bifidobacterium in control, susceptible and resilient mice.

Data are shown as the dot plot of each mouse (control group: n = 8, susceptible group: n = 8, resilient group: n = 6). **P < 0.01 compared to control group (Fisher’s exact test). CSDS: chronic social defeat stress.
