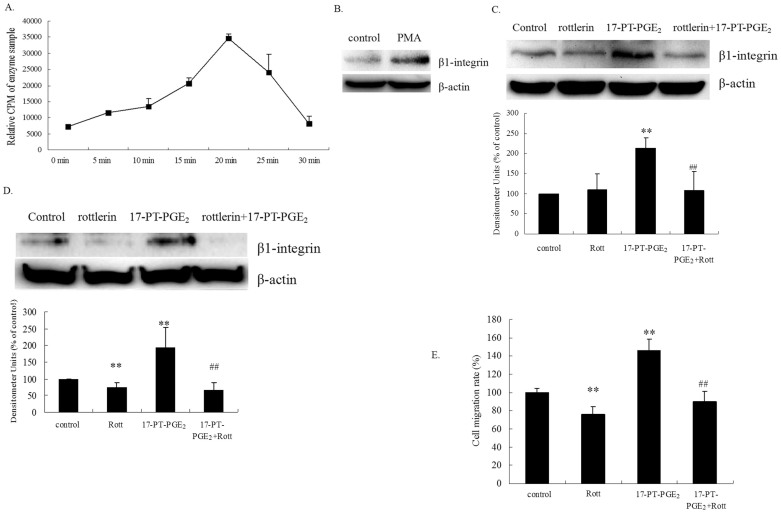
Figure 3. PKC is involved in EP1 receptor-mediated β1-integrin upregulation in hepatocellular carcinoma cells.
(A). PKC activity assay. Huh-7 cells were treated with 5 μM 17-PT-PGE2 for 0, 5, 10, 15, 20, 25 or 30 min. Equal amounts of total proteins (30 μg) were added to microcentrifuge tubes and assayed for PKC levels using a direct human PKC enzyme activity assay kit. (B). Effect of a PKC activator on β1-integrin expression in Huh-7 cells. Huh-7 cells were treated with 100 nM PMA for 24 h. Total protein was isolated and visualized with an anti-β1-integrin antibody. Levels of β-actin served as a loading control. (C). Effect of a PKC inhibitor on 17-PT-PGE2-mediated β1-integrin expression in Huh-7 cells. Huh-7 cells were treated with 17-PT-PGE2 for 24 h, with or without pre-treatment of 5 μM rottlerin for 1 h. Total protein was isolated and visualized with an anti-β1-integrin antibody. Levels of β-actin served as a loading control. The cropped gels are used and full-length gels are presented in Supplementary Figure S7. Results are presented as the mean ± SD from three different experiments. **P < 0.01, compared with control cells; ##P < 0.01, compared with 17-PT-PGE2 –treated group. (D). Effect of a PKC inhibitor on 17-PT-PGE2-mediated β1-integrin expression in EP1 receptor-expressed HEK293 cells. Stable EP1 receptor-expressed HEK293 cells were treated with 17-PT-PGE2 for 24 h, with or without pre-treatment of rottlerin for 1 h. Total protein was isolated and visualized with an anti-β1-integrin antibody. Levels of β-actin served as a loading control. Results are presented as the mean ± SD from three different experiments. **P < 0.01, compared with control cells; ##P < 0.01, compared with 17-PT-PGE2 –treated group. (E). Effect of a PKC inhibitor on 17-PT-PGE2-mediated cell migration in Huh-7 cells. The cell migration assay was performed in a12-well transwell plate. Huh-7 cells were treated with 17-PT-PGE2 for 12 h, with or without pre-treatment of 5 μM rottlerin for 1 h. Cells on the lower surface were stained with 0.1% crystal violet, solubilized with acetic acid solution and quantified by measuring their absorbance at 570 nm. Results are presented as the mean ± SD from three different experiments. **P < 0.01, compared with control cells; ##P < 0.01, compared with 17-PT-PGE2-treated cells. The gels have been run under the same experimental conditions.

