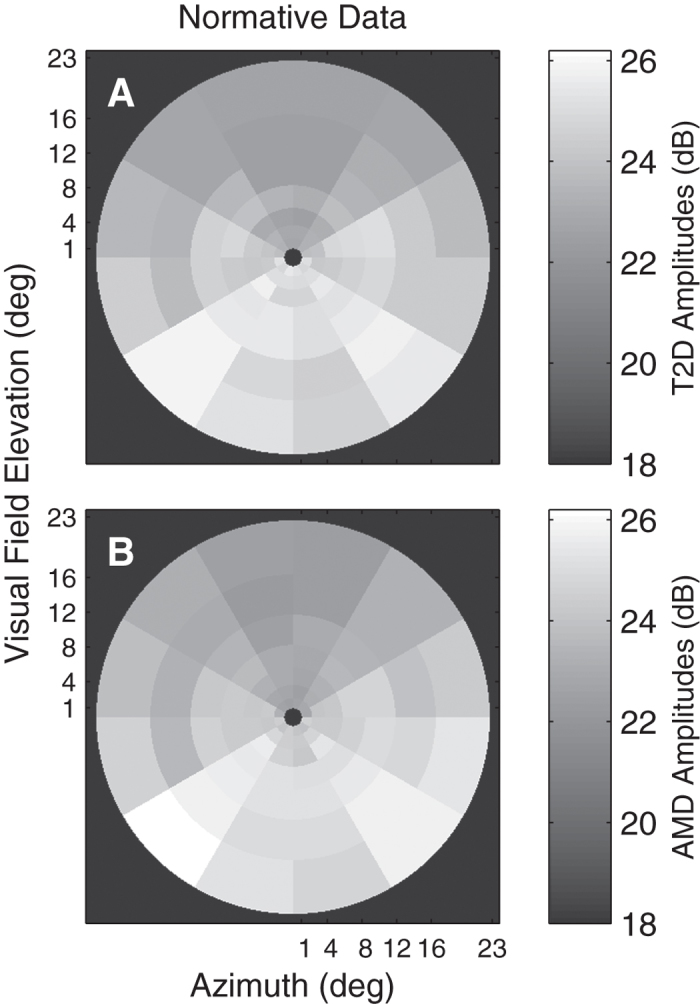
Figure 4. Mean response amplitudes for control subjects in AMD and T2D.

A and B show the means across the Occipital Pole electrode data for the normal control eyes, where the input for each region was the peak RMS value from each electrode for each region. Data are presented as if for left eyes with the temporal field at left. (A) Normative data for the 44 normal control eyes of the T2D study. (B) The normative data from the 56 normal control eyes of the AMD study. The minimum amplitude in either plot is 22.3 dB. The black background corresponds to 18 dB allowing small differences it be seen across the field. The T2D and AMD data were collected 4 months apart and there were no common subjects, nevertheless they are remarkably similar. The gradient of responses from superior to inferior is typical for VEPs for scalp electrodes.
