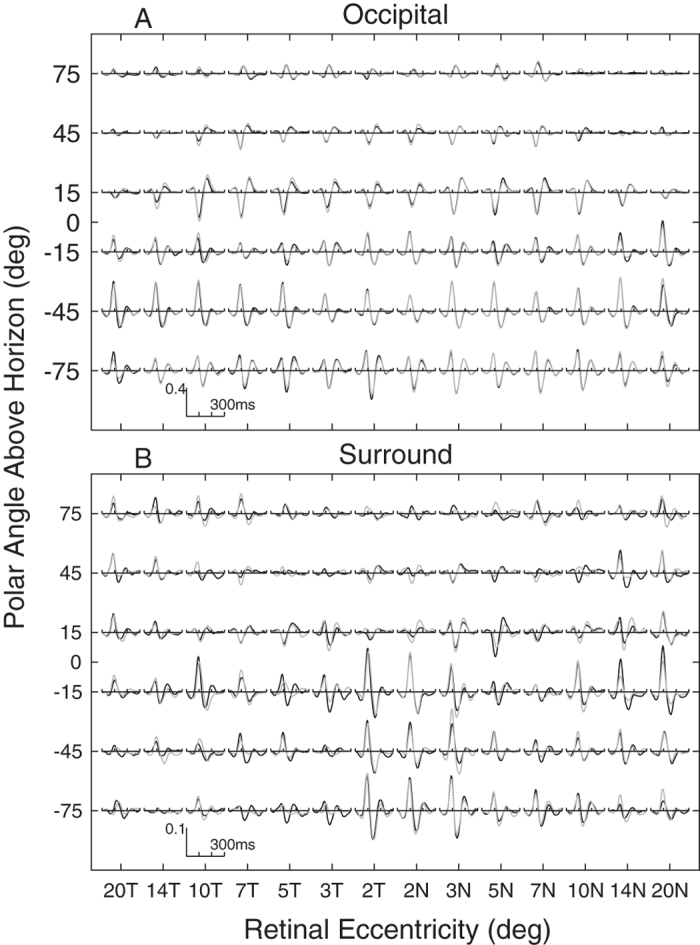
Figure 6. Mean mfVEP waveforms for each of the 84 visual field locations.

Mean waveforms were computed across subjects and electrodes, black traces are for left eyes, and grey for right. Where right eye data overlaps left only grey is seen. The data are means across the 51 control subjects from both studies. (A) Occipital electrode data show inversion of waveform sign about the horizontal meridian (polar angle = 0 on ordinate). (B) Surround electrodes show a mixture near fixation and no inversion peripherally. Eyes were averaged as if both were left eyes with the temporal field on the left. The axes are a log-polar layout as on the cortex, with log-eccentricity from fixation on the abscissa running from 20 degrees temporal (20T) to 20 degrees nasal (20N), and polar angle on the ordinate. The left and right half-rows thus represent the radial spokes of the stimulus array (cf. Fig. 2).
