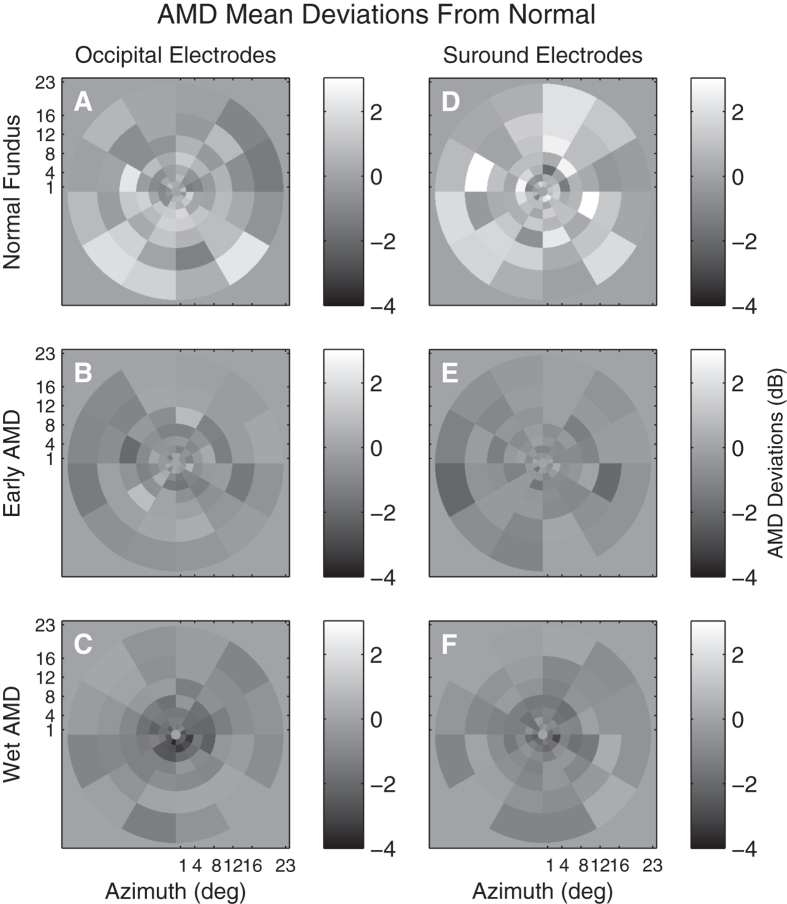
Figure 8. Mean response deviations from the normative data (e.g. Fig. 3B) for three severities of AMD.
Response deviations measured from Occipital (A to C) or Surrounding (D to E) electrodes. The plots are thus similar to Fig. 5A,C. The grey background indicates 0 difference from normal. The top row (A,D) are for the 4 fellow eyes that showed a clinically normal fundus appearance for persons aged 74 years. The middle row (C,E) are for the 17 eyes with early AMD characterised by drusen and pigmentary changes. The bottom row represent the 17 eyes with exudative AMD (exudative).

