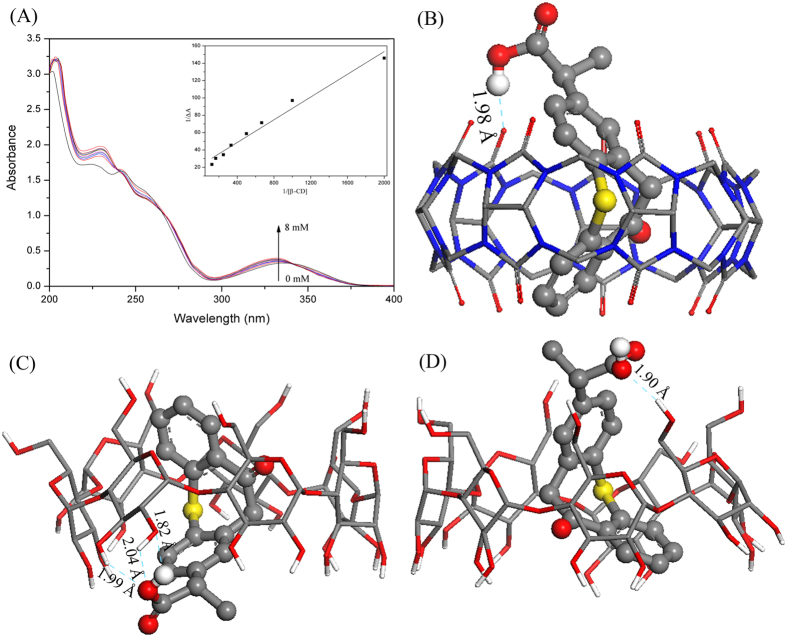
Figure 2.
(A) Absorption spectra of ZPF in the presence of various concentrations of β-CD from 0, 0.5, 1.0, 1.5, 2.0, 3.0, 4.0, 6.0, 8.0 × 10⁻³ M; Insert: the Benesi–Hildebrand plot of 1/∆A against 1/[β-CD]. (B) Docking conformation of CB[7] and ZPF. (C,D) Two main docking conformations of β-CD and ZPF.

