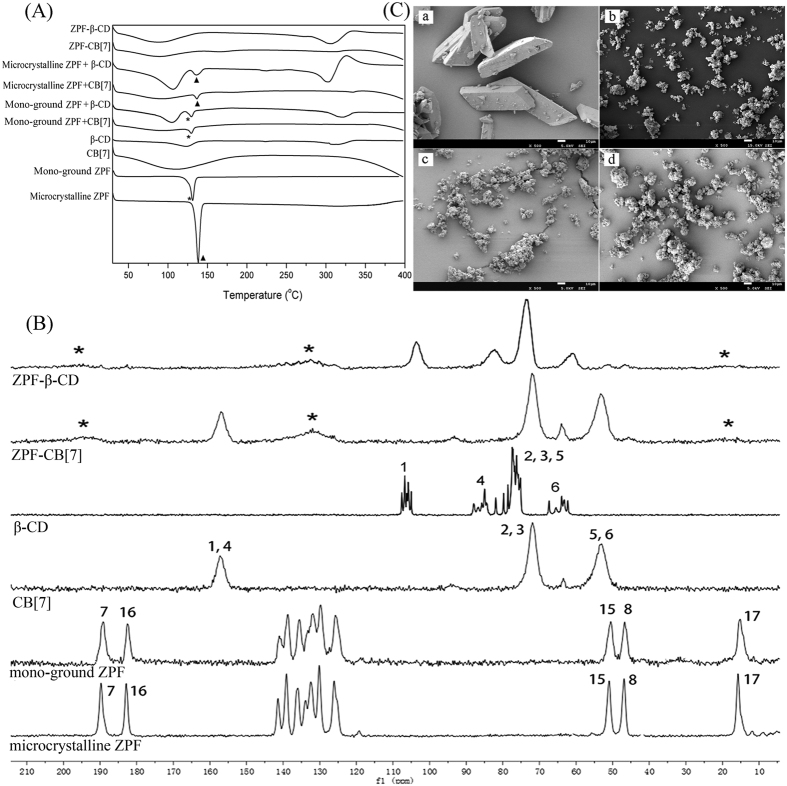
Figure 4.
(A) DSC curves of microcrystalline ZPF, mono-ground ZPF and their corresponding physical mixtures and co-ground dispersions. (B) 13C CP/MAS NMR spectra of microcrystalline ZPF, mono-ground ZPF, CB[7], β-CD, ZPF−β-CD and ZPF−CB[7]. Numbering for assignments corresponds to Figure 1. (C) SEM images of (a) microcrystalline ZPF, (b) mono-ground ZPF, (c) ZPF−CB[7], and (d) ZPF−β-CD at 500 × magnification.

