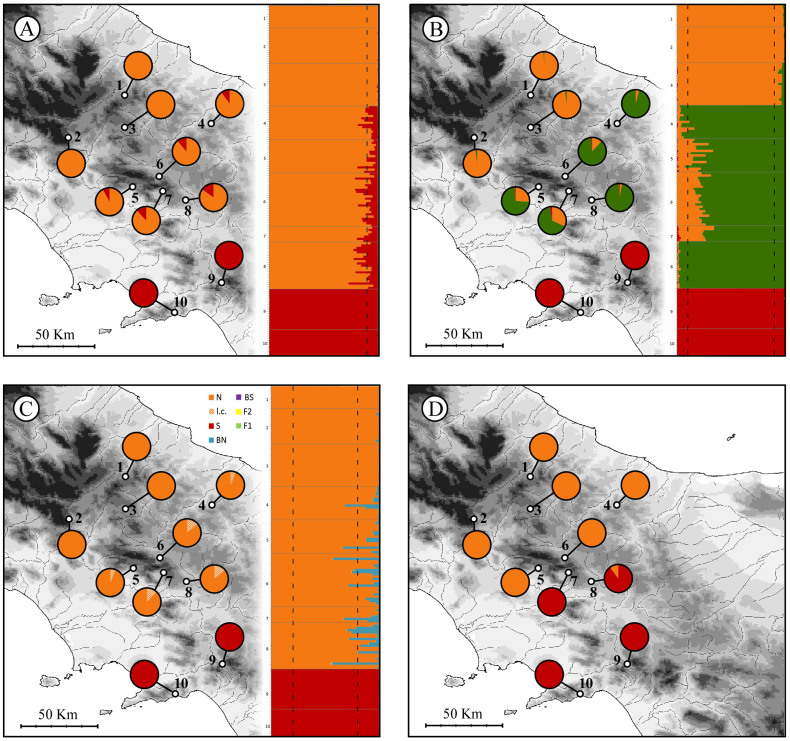
Figure 3. Admixture proportions of each studied individual (barplots) and population sample (pie-diagrams) estimated using STRUCTURE with k = 2 (A) and k = 3 (B), probability of assignment to a particular hybrid class estimated using NEWHYBRID (C), and frequency of S. terdigitata (red) and S. perspicillata (orange) mitotypes within the studied samples (D).
Optimal threshold values estimated with HYBRIDLAB (STRUCTURE: 10–90%; NEWHYBRID: 20–80%) are shown on the barplots as dashed lines. N: pure S. perspicillata; l.c.: pure S. perspicillata assigned with lower confidence; S: pure S. terdigitata; BS: backcross to S. terdigitata; BN: backcross to S. perspicillata; F1 and F2: first and second generation hybrids respectively. The map was drawn using the software Canvas 11 (ACD Systems of America, Inc.).

