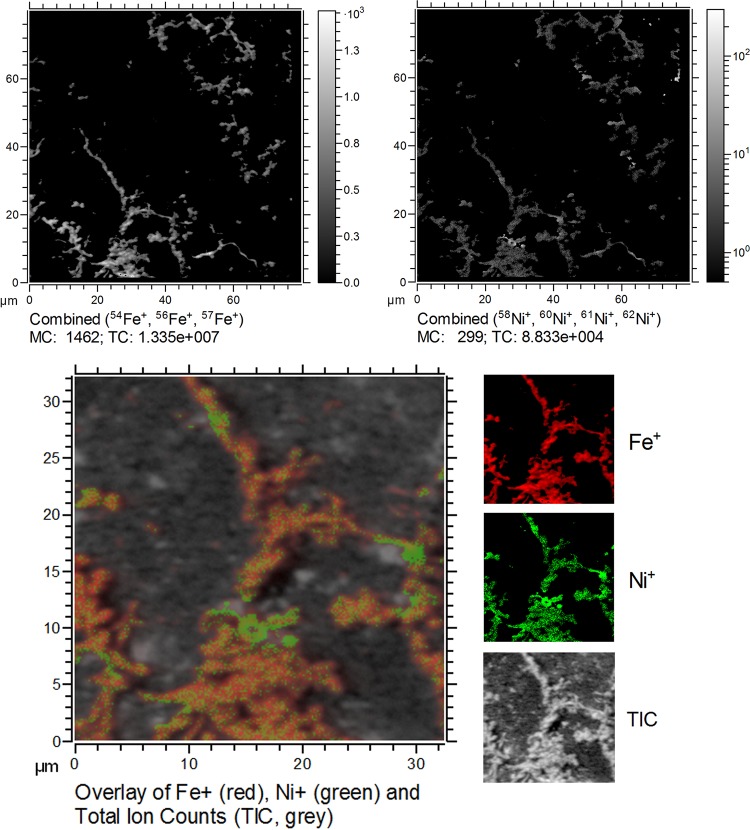
FIG 8.
TOF-SIMS measurements of stalks produced by the isolates from Norsminde Fjord grown on ZVI plates in artificial seawater medium containing 100 nM Ni2+. The upper images show the distribution of Ni+ and Fe+ ion yield (mind the different intensity scaling) within the area of the twisted stalks (defined by the Fe+ ion yield map). The lower image shows an overlay of both ion yield maps (Fe+ in red, Ni+ in green). MC, mass counts (in pixels); TIC, total ion counts.

