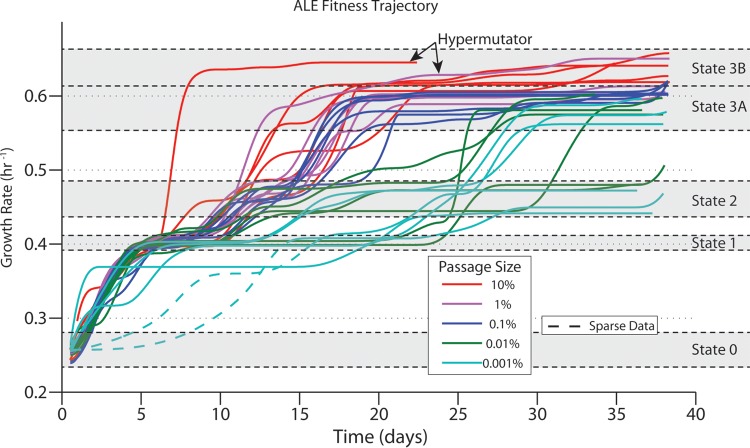
FIG 3.
Fitness trajectories of E. coli evolved on glycerol. The absolute growth rates of independently evolved cultures of E. coli, as fitted by a cubic spline for all ALE experiments, are indicated for different passage sizes. Dashed lines represent regions where the spline fit is based on sparse data and therefore is not considered accurate. The small upturn in growth rates at the endpoint is an artifact of the spline interpolation and is ignored in determinations of endpoint growth rates. All except five ALE experiments reached fitness state 3. The rates at which the final growth rate was achieved varied. The hypermutating strain with a passage size of 10% reached state 3 significantly faster than all others (it possessed a mutation in mutY). The purple hypermutating strain was identified as a potential hypermutating strain based on the number of mutations fixed (P = 0.003; false discovery rate, 0.087) and the presence of a frameshift insertion in mutL.

