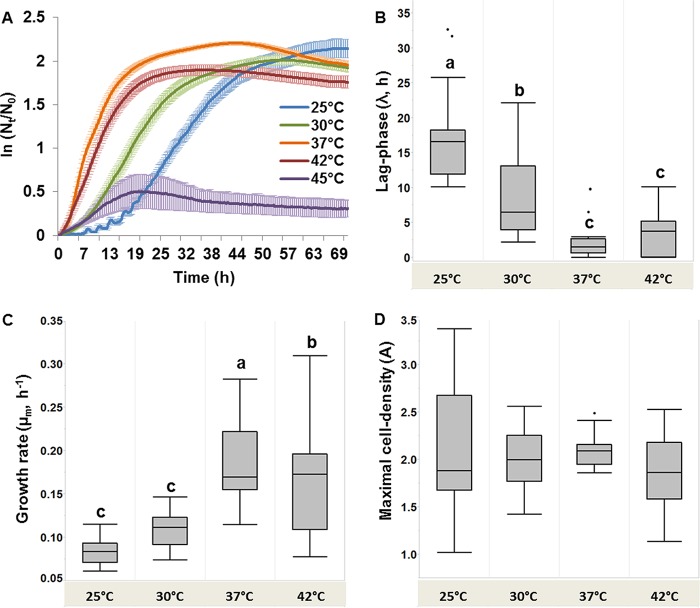
FIG 1.
(A) L. pneumophila growth curves representing the ln(Nt/N0) average ± standard error values for all analyzed strains (n = 32) at five different temperatures; (B) box plot representing the distributions of lag-phase lengths (λ, hours) at different temperatures (n = 32); (C) box plot representing the distributions of maximal specific growth rates (μm, hours−1) at different temperatures (n = 32); (D) box plot representing the distributions of maximal cell densities (A) (n = 32). Box plot values were derived from the fitted model for each of the L. pneumophila strains analyzed at each of the studied temperatures (see Table S2 in the supplemental material). Boxes with different letters at the top indicate significant differences by repeated-measures ANOVA tests and Tukey's HSD post hoc test with a confidence level of 95%.

