
Figure 2.
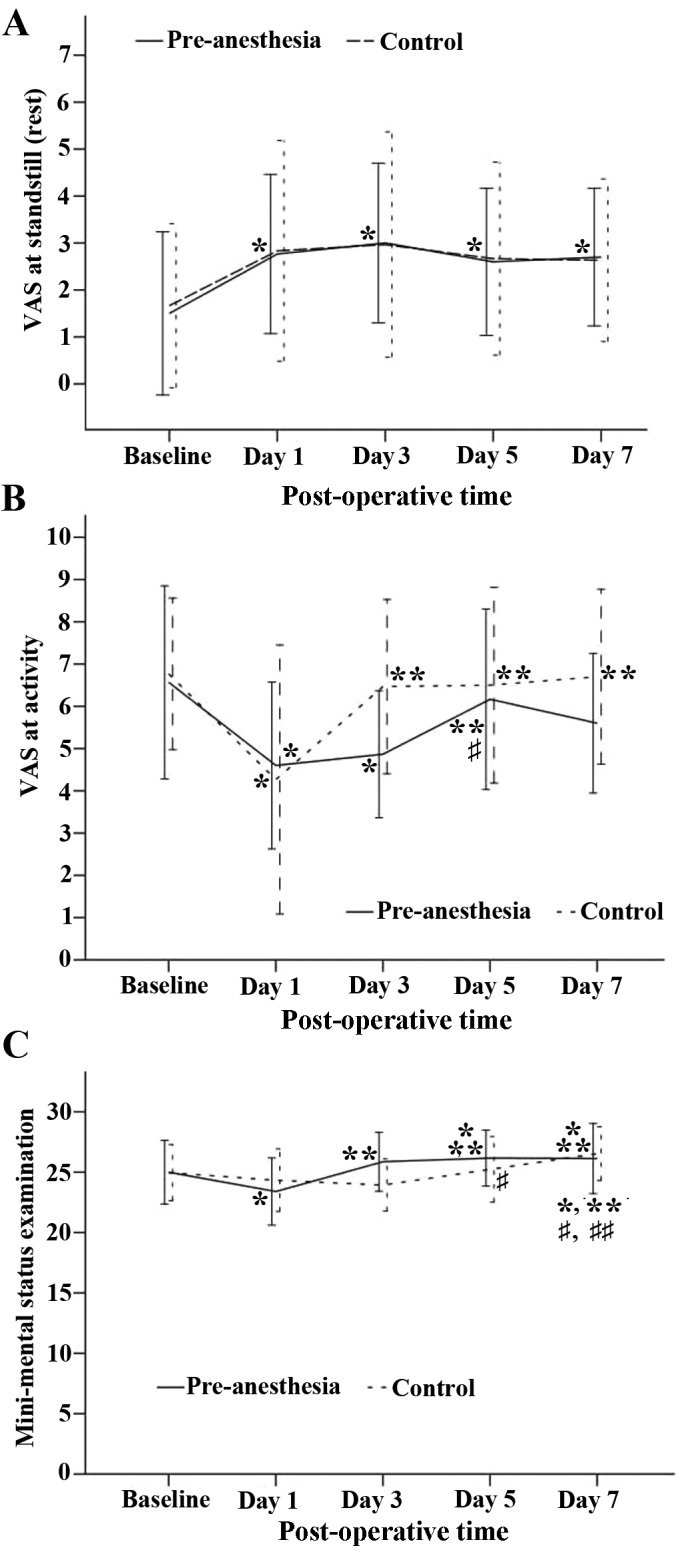
Changes in VAS score between days 1–5. (A) Changes in VAS at rest and (B) during activity. (C) The mini mental state examination of all patients over time. Data are expressed as mean ± standard deviation and tested by generalized estimation equation. The post hoc test of time effect was examined using the Bonferoni correction. The data from the pre-anesthesia group are presented as solid lines and the results from the control group are presented as dotted lines. P<0.05 vs. *baseline, **day 1, #day 3 and ##day 5. VAS, visual analog scale.