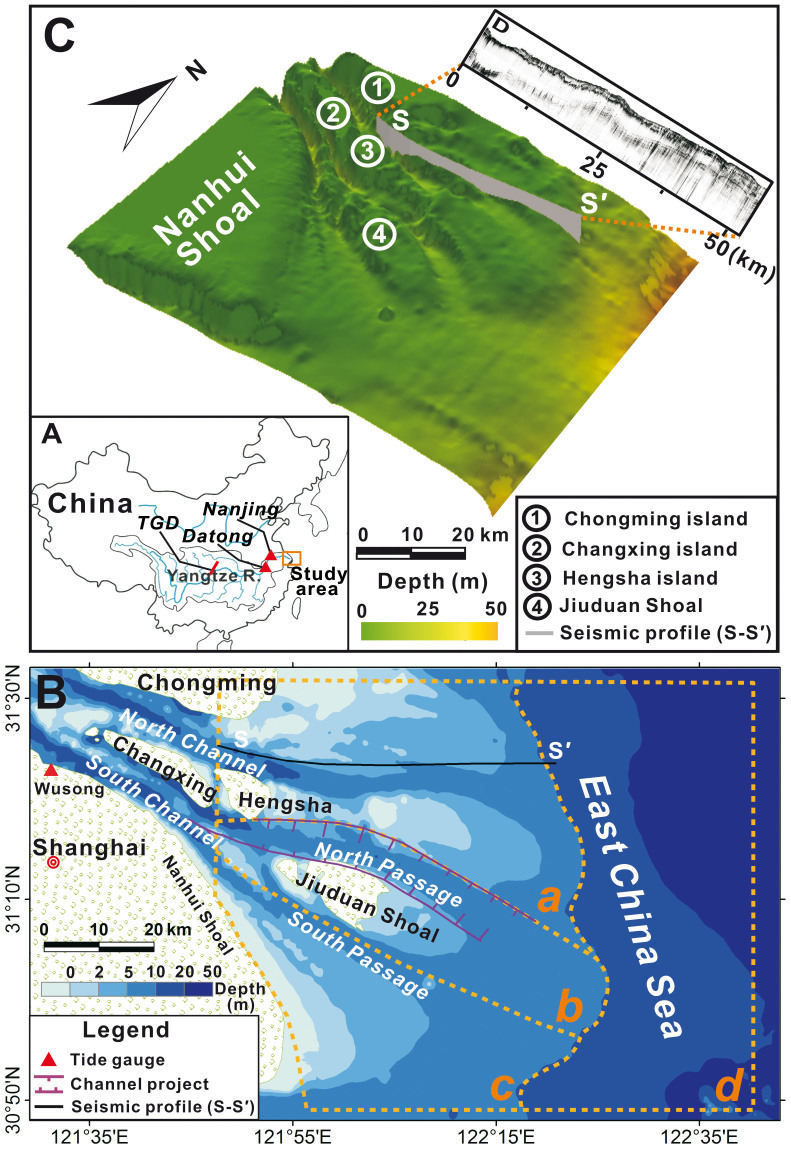
Figure 1.
(A) A map of China indicating the location of the Changjiang Estuary and the study area (red dashed polygon), (B) The area bathymetric map of the study area (features indicated by the alphabet are explained below),(C) the 3-D view of the CSD, (D) sub-surface seismic survey image. Figure 1 was drawn by software ArcGis 9.3. Features in (B) indicate: a: the region above the -10 m isobath between the N. Channel and N. Passage; b: the region above the -10 m isobath between the N. and S. Passages; c: the region of the Nanhui Shoal and S. Passage above the -10 m isobath; d: the seaward region below the -10 m isobath.

