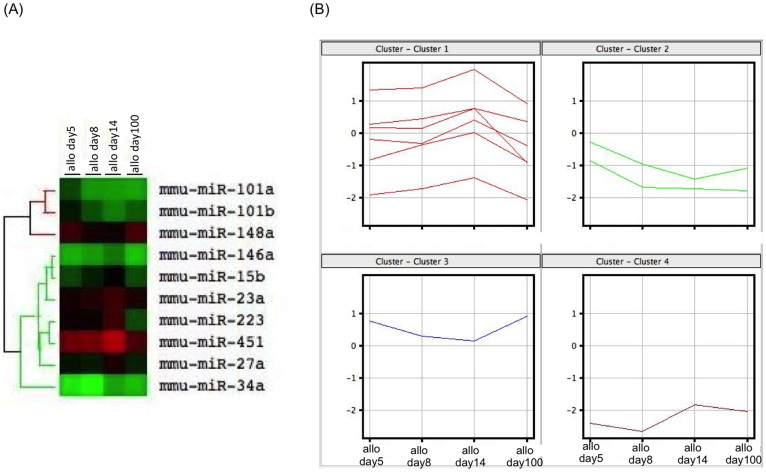
Figure 3. The differential expression of the miRNAs was monitored on days 5, 8, 14 and 100 postallograft compared with that observed in the syngeneic grafts on day 5.
(A) A heat map representation of the differentially regulated miRNAs in the hepatic allografts at different time points after hepatic transplantation compared with that observed in the syngeneic grafts on day 5. The progressively brighter shades of red indicate a gradual increase in the miRNA concentration, whereas the shades of green indicate a gradual decrease in the miRNA expression levels. The expression levels ranged from -3-fold to 3-fold. A miRNA clustering tree is shown on the left. The microarray results were hierarchically clustered using the GeneCluster program. (B) A cluster analysis of the 10 miRNAs showed a >3-fold change between day 5 after syngeneic grafting and day 14 after allograft transplantation (p < 0.05). Clusters 1 and 4 contain miR-146a, 15b, 23a, 223, 451 and 27a, and miR-34a, respectively. Clusters 2 and 3 contain miR-101a and 101b, and 148a, respectively. All experiments, data were analyzed of three mice per each time point.

