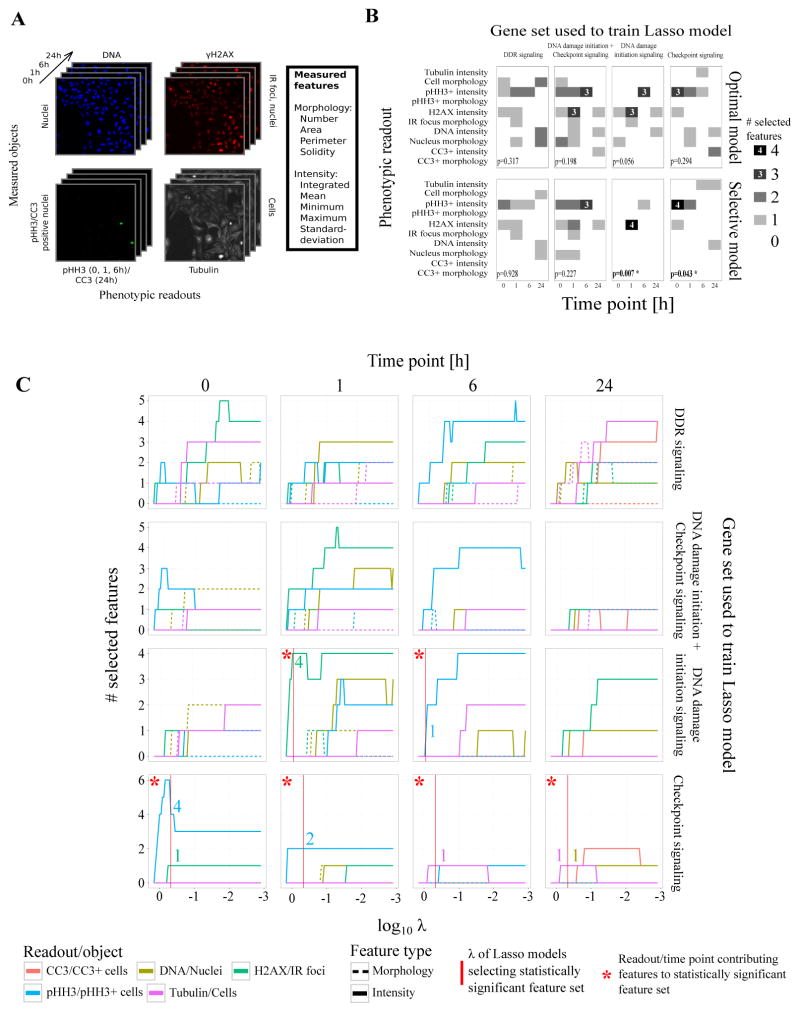
Figure 2.
Logistic regression with Lasso regularization selects the most informative phenotypic readouts and time points that best capture the differences between a knocked-down gene and negative controls.
(A) Images of four fluorescent channels recorded by automated microscopy capturing five phenotypic readouts at four time points. Each readout is used to identify different biological objects (DNA: nuclei; γH2AX: IR-induced foci; pHH3/CC3: pHH3/CC3 positive cells; tubulin: cells). Cell Profiler was used to generate 60 numeric features capturing morphological and intensity characteristics of each recorded object.
(B) Readout profiles for feature sets selected by the optimal and selective Lasso models for four different sets of genes. A readout profile describes how many features were selected for each phenotypic readout at each time point. Only functionally coherent gene sets (DNA damage initiation signaling and checkpoint signaling) led to models that selected statistically significant feature sets with a confidence level of 95%. Readout-time point combinations with more than two selected features were additionally labeled for improved readability. P-values reflect the statistical significance of a readout profile’s Shannon entropy.
(C) Readout traces for different Lasso models as function of the tuning parameter λ at four time points (0, 1, 6, 24h). Colored lines represent the number of selected features per readout for any given λ. They indicate what readouts and time points best capture the phenotypic characteristics that differentiate knocked-down genes from negative controls. As λ increases, fewer features are selected. For DNA damage initiation signaling genes, the γH2AX readout at the 1h time point and the pHH3 readout at the 6h time point are most predictive.

