Figure 3.
M-RAM outperforms 2BHM.
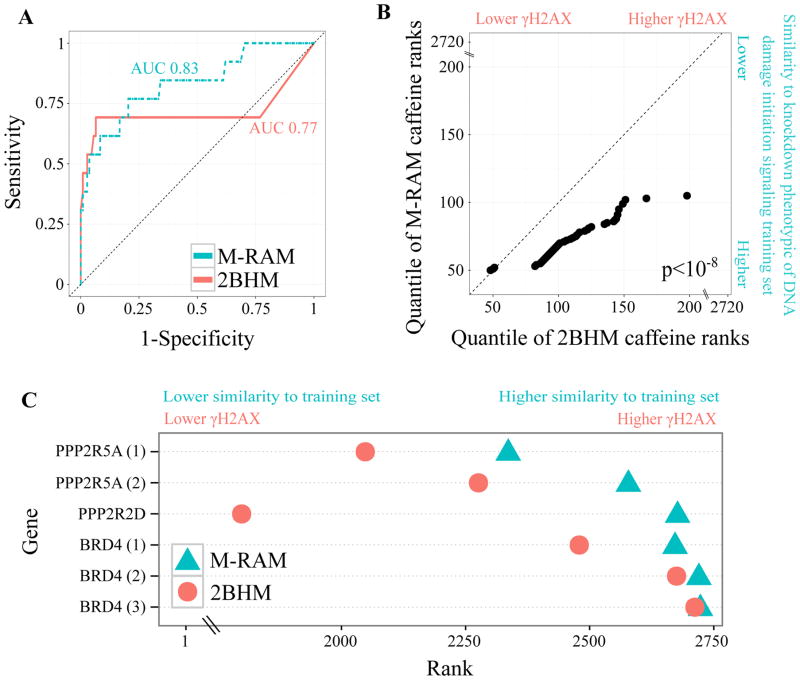
(A) ROC curve comparing M-RAM’s (selective Lasso model for DNA damage initiation signaling) and 2BHM’s performance using leave-one-out cross validation. M-RAM provides superior sensitivity and specificity. AUC refers to area under the receiver operating characteristic (ROC) curve.
(B) Q-Q plot comparing the ranking of independent caffeine controls by M-RAM and 2BHM. M-RAM ranks the independent caffeine controls more accurately than 2BHM (closer to zero which indicates lower γH2AX and higher similarity to knock-down of genes belonging to DNA damage initiation signaling). Additionally, M-RAM ranks the controls more precisely (ranks provided by M-RAM have less than half the statistical spread than ranks provided by 2BHM). The p-value was computed using a Wilcoxon rank-sum test.
(C) Dot plot of Brd4 and selected PP2A subunit ranking as provided by M-RAM and 2BHM. As in (B), M-RAM ranks the genes more precisely and more accurately than 2BHM. Brd4 and PPP2R5A are displayed more than once because they were independently screened on multiple different plates.

