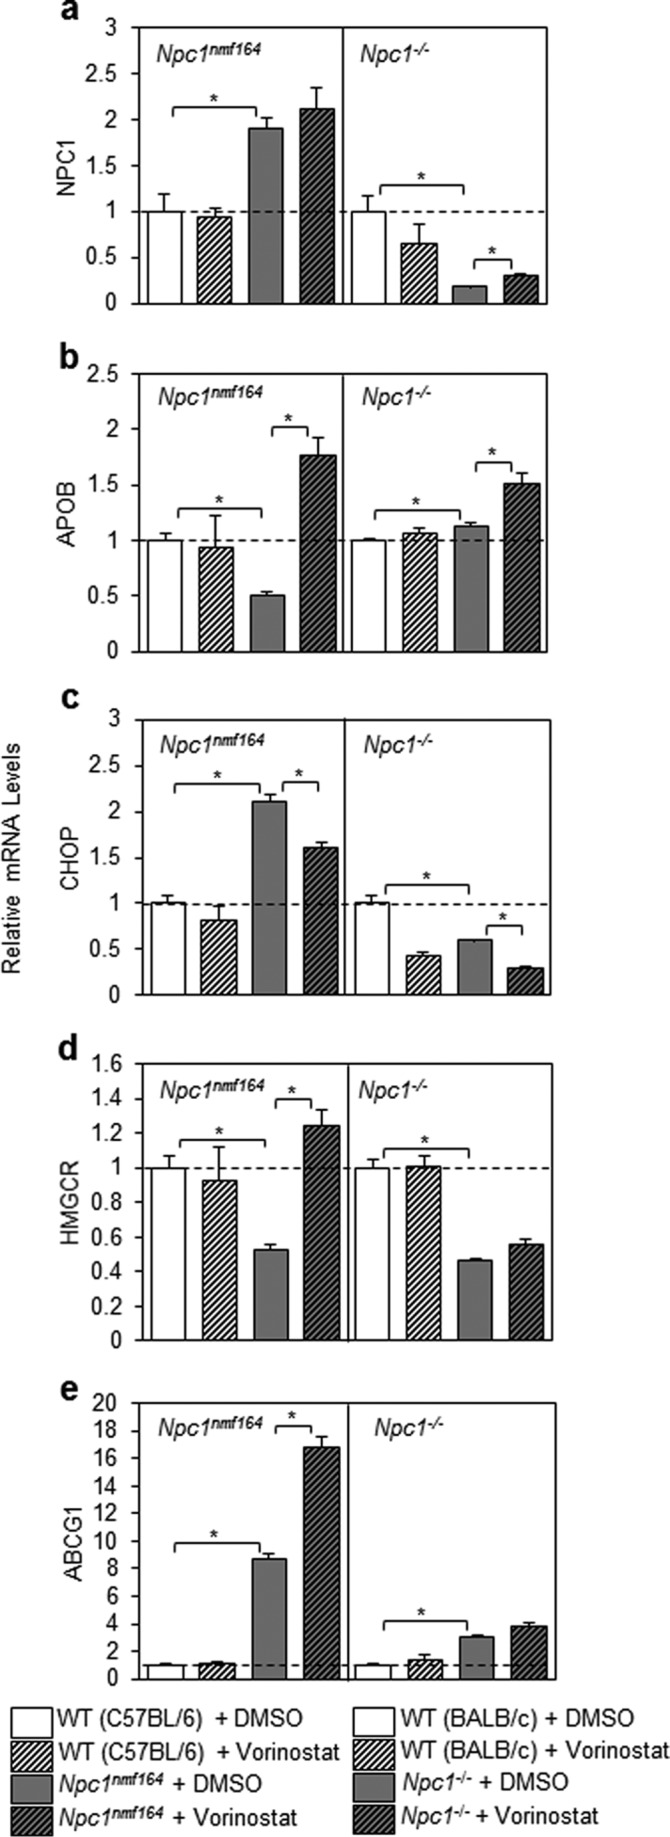
FIGURE 10.

Transcriptional response of Npc1nmf164 and Npc1−/− hepatocytes following treatment with vorinostat. Hepatocytes were isolated from livers of Npc1nmf164 and Npc1−/− mice; incubated for 24 h in DMEM + 10% FBS with 10 μm vorinostat or DMSO; and assessed for Npc1, Apob, Chop, Hmgcr, and Abcg1 gene expression by qRT-PCR relative to cyclophilin (CYCLO) and appropriate WT controls using primers described under “Experimental Procedures.” All groups are n = 3 with data shown as mean ± S.D. (error bars) *, p < 0.05, Student's t test.
