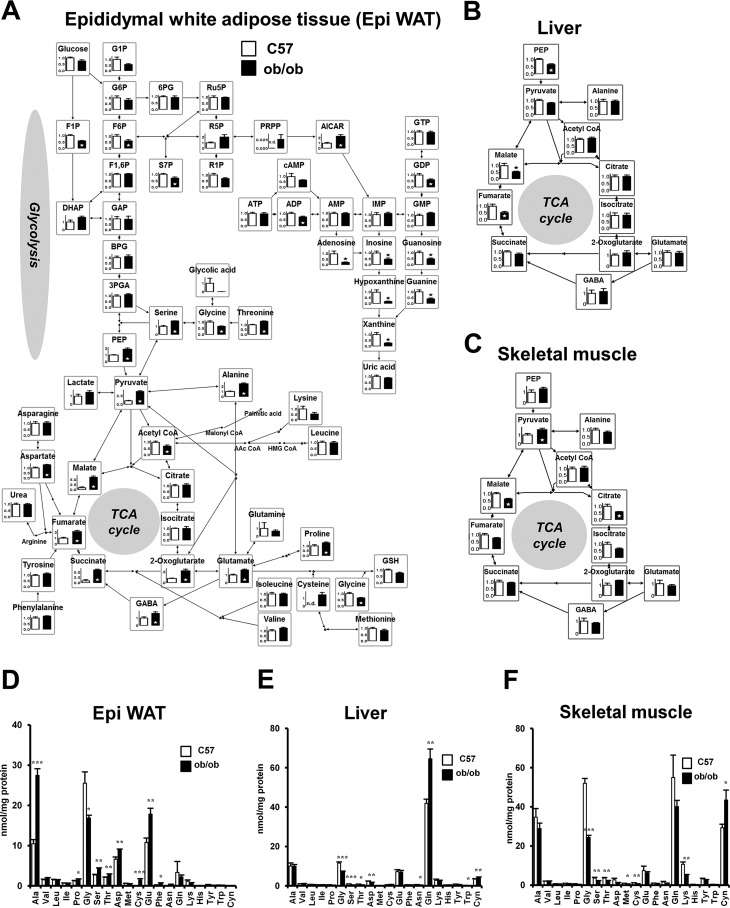
FIGURE 1.
Static metabolic analysis of central carbon metabolism in Epi WAT, liver, and skeletal muscle of C57 and ob/ob mice. Analysis of 11-week-old male C57 and ob/ob mice (n = 6/group). A, relative levels of Epi WAT metabolites. B, changes in metabolites associated with the TCA cycle in the liver. C, changes in metabolites associated with the TCA cycle in skeletal muscle. The level of each metabolite in C57 mice was set at 1. *, p < 0.05, C57 versus ob/ob mice. D–F, quantitative amino acid analysis of Epi WAT (D), liver (E), and skeletal muscle (F). Data are mean ± S.E. *, p < 0.05; **, p < 0.01; ***, p < 0.001, C57 versus ob/ob mice. G1P, glucose 1-phosphate; G6P, glucose 6-phosphate; 6PG, 6-phosphogluconate; Ru5P, ribulose 5-phosphate; 5P, ribose 5-phosphate; F6P, fructose 6-phosphate; F1P, fructose 1-phosphate; F1,6P, fructose 1,6-bis-phosphate; S7P, sedoheptulose 7-phosphate. DHAP, dihydroxyacetone phosphate; GAP, glyceraldehyde 3-phosphate; BPG, 1,3-bisphosphoglycerate; 3PGA, 3-phosphoglycerate; PEP, P-enolpyruvate; PRPP, phosphoribosyl pyrophosphate; AICAR, 5-aminoimidazole-4-carboxamide ribonucleoside; n.d., not detected.

