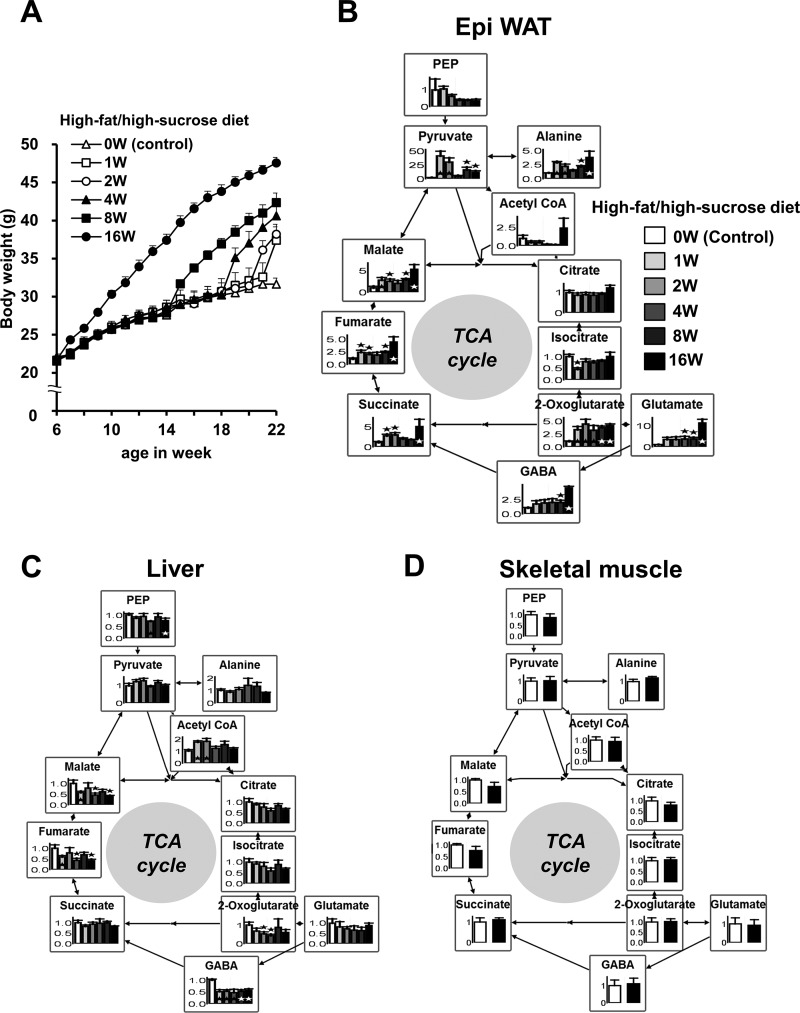
FIGURE 2.
Static metabolic analysis of the TCA cycle for Epi WAT, liver, and skeletal muscle of DIO mice. At 6 weeks (W) of age, male C57 mice were randomly divided into six treatment groups (n = 6/group). DIO mice were fed a high-fat/high-sucrose diet from 6 weeks of age for 16 weeks, from 14 weeks of age for 8 weeks, from 18 weeks of age for 4 weeks, from 20 weeks of age for 2 weeks, and from 21 weeks of age for 1 week to 22 weeks of age, whereas mice of the control group were fed a regular diet from 6–22 weeks of age (0 weeks). All mice were analyzed at the age of 22 weeks after 4-h fasting. A, changes in body weight for each group. B, relative levels of metabolites in Epi WAT. C, relative levels of metabolites in the liver. D, relative levels of metabolites in skeletal muscle of control mice (0 weeks) and DIO mice (16 weeks). The level of each metabolite in the control group was set at 1. Data are mean ± S.E. *, p < 0.05, control versus DIO group(s).

