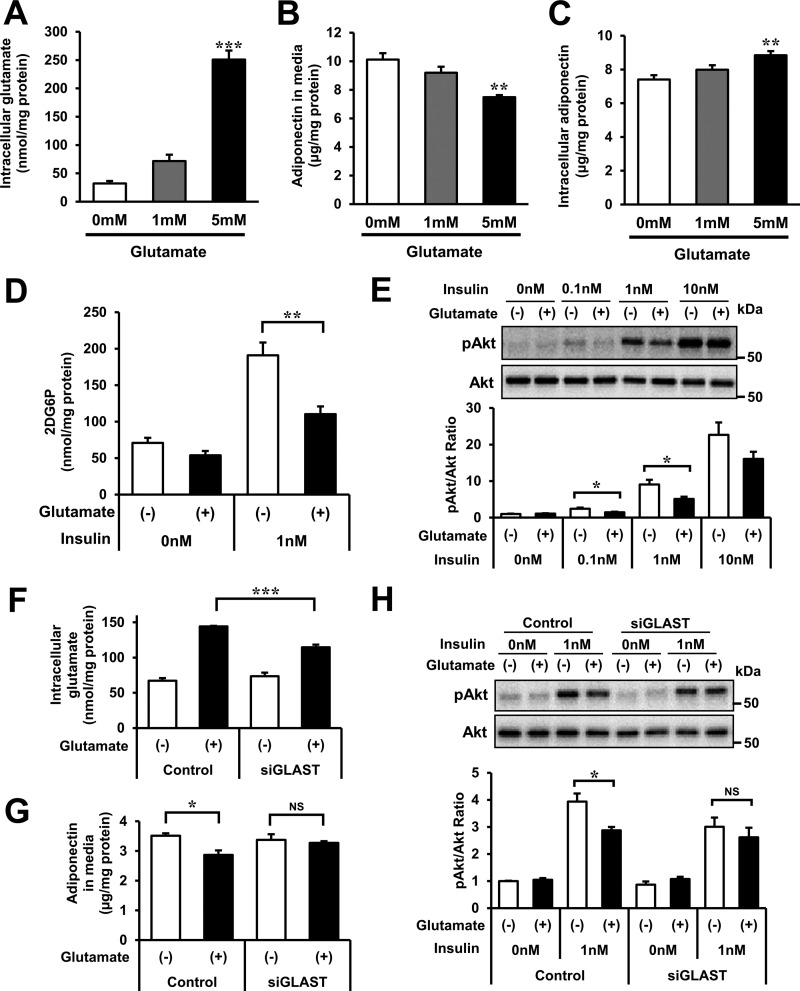
FIGURE 8.
Effects of glutamate on adipocyte function in 3T3-L1 mature adipocytes. A–D, intracellular glutamate (A), adiponectin protein in culture media (B), and intracellular adiponectin protein (C) in experiments of 3T3-L1 mature adipocytes treated with or without 1 and 5 mm glutamate. In all experiments, cells were exposed to glutamate for 24 h. A–C, n = 4/group. D, glucose uptake as measured by 2DG-6-phosphate accumulation in 3T3-L1 mature adipocytes incubated with or without 5 mm glutamate for 24 h (n = 4/group). 3T3-L1 mature adipocytes were stimulated with or without 1 nm insulin for 10 min after 14 h FBS starvation. E, the ratio of serine-phosphorylated Akt (pAkt) to total Akt in 3T3-L1 mature adipocytes incubated with or without 5 mm glutamate for 24 h. 3T3-L1 mature adipocytes were stimulated with 0, 0.1, 1, or 10 nm insulin for 5 min after 14-h FBS starvation. Top panel, representative Western blotting analysis. Bottom panel, quantitative analysis of pAkt/Akt ratio in the top panel (n = 3/group). The pAkt/Akt ratio of the control group (without glutamate or insulin treatment) was set at 1. F and G, intracellular glutamate (F) and adiponectin protein levels in culture media (G) in gene knockdown experiments of GLAST in 3T3-L1 mature adipocytes treated with or without 5 mm glutamate for 24 h (n = 4/group). H, the ratio of serine-phosphorylated Akt to total Akt in knockdown of GLAST of 3T3-L1 mature adipocytes incubated with or without 5 mm glutamate for 24 h. 3T3-L1 mature adipocytes were stimulated with or without 1 nm insulin for 5 min after 14-h FBS starvation. Top panel, representative Western blotting analysis. Bottom panel, quantitative analysis of the pAkt/Akt ratio in the top panel (n = 3/group). The pAkt/Akt ratio of the control group was set at 1. *, p < 0.05; **, p < 0.01; ***, p < 0.001 versus control. The data in A–H are mean ± S.E.

