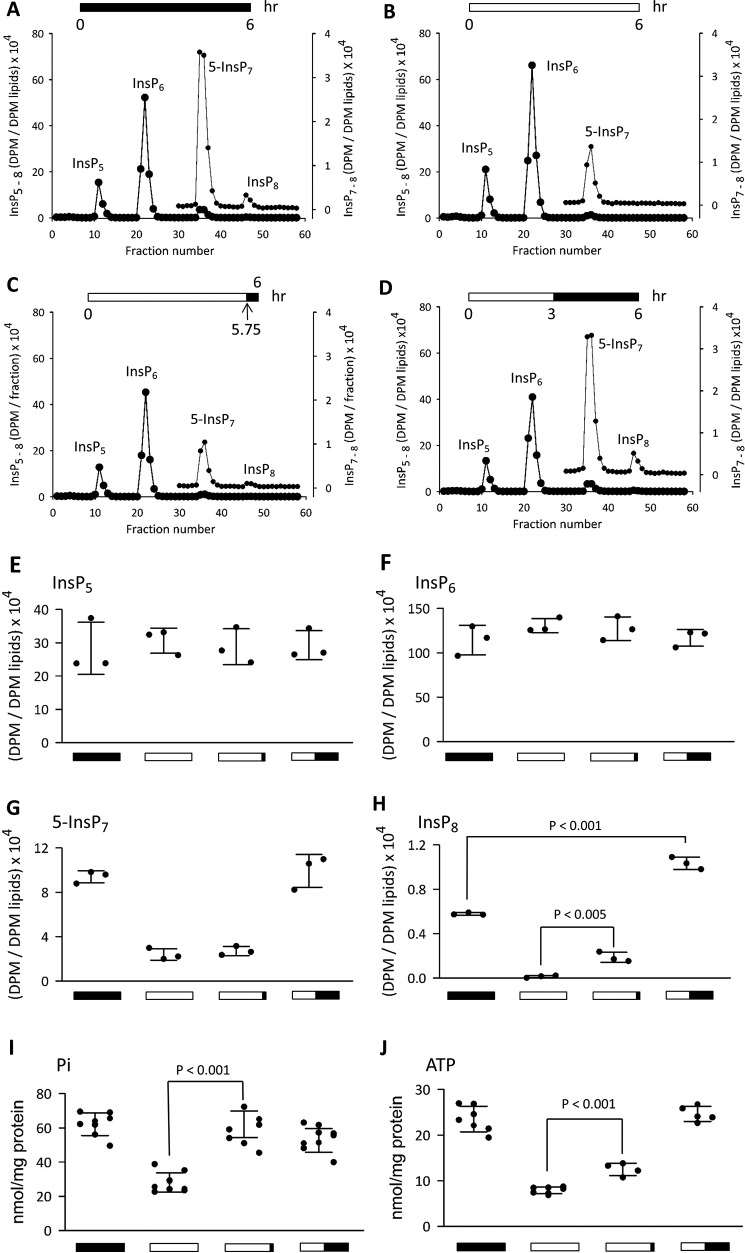
FIGURE 3.
The effects of Pi starvation and replenishment upon intracellular levels of inositol phosphates, ATP, and Pi in HCT116 cells. [3H]Inositol-labeled HCT116 cells were treated to four different conditions of extracellular Pi availability as represented schematically by the horizontal bar at the top of each panel (filled bar, 2 mm Pi; empty bar, 0 mm Pi): A, 2 mm Pi for 6 h; B, no Pi for 6 h; C, no Pi for 5. 75 h followed by 2 mm Pi for 0.25 h; D, no Pi for 3 h followed by 2 mm Pi for 3 h. Next, cells were quenched, and the levels of the indicated inositol phosphates (InsP5, InsP6, InsP7, and InsP8) were analyzed by HPLC (see “Experimental Procedures”). Data for InsP7 and InsP8 are replotted on an expanded y axis scale. A–D are representative of three biological replicates; scatter plots (error bars represent S.D.) are compiled from all three experiments in E (InsP5), F (InsP6), G (InsP7), and H (InsP8). The identification of InsP7 as the 5-isomer is based on our previous work with HCT116 cells in which our HPLC procedures were shown to resolve 5-InsP7 from 1-InsP7; the latter is a minor isomer that comprises <2% of total InsP7 (27). The graphics below the x axes correspond to those described above that depict the various extracellular [Pi] conditions. Scatter plots (error bars represent S.D.) in I and J show total intracellular Pi (malachite green/molybdate method; n = 8–10) and ATP (n = 4–7), respectively, determined in parallel experiments with non-radiolabeled cells. The mean values for cell Pi content (nmol/mg of protein) from left to right are as follows (error bars represent S.D.): 62 ± 2.3, 28 ± 1.9, 62 ± 2.7, and 53 ± 2.2; these values closely match the Pi levels that were obtained by an independent enzymatic method (60 ± 5.6, 32 ± 2.5, 59 ± 2.9, and 50 ± 2.7; n = 6).

