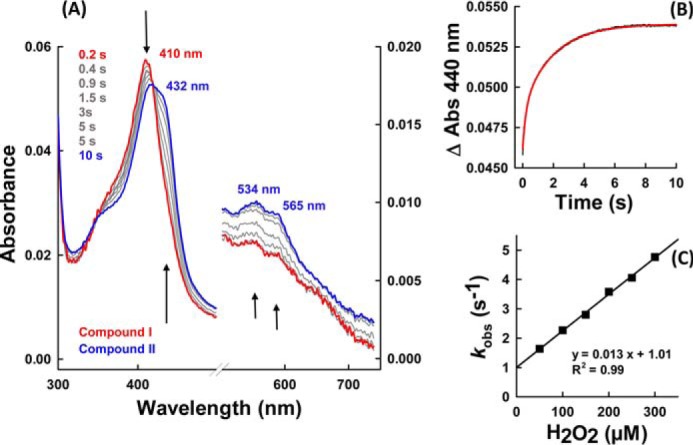
FIGURE 6.

Reduction of compound I to compound II mediated by hydrogen peroxide. A, spectral changes (arrows) of 1 μm hsPxd01-con4 compound I reacting with 50 μm hydrogen peroxide. Compound I was formed after 200 ms in the aging loop. B, time trace of reaction between 500 nm compound I of hsPxd01-con4 and 300 μm hydrogen peroxide measured in the sequential stopped-flow mode (delay time of 200 ms for compound I formation). The time trace (black line) was fitted double exponentially (red line). C, pseudo first-order rate constant of 500 nm hsPxd01-con4 compound I reacting with 50, 100, 150, 200, 250, and 300 μm hydrogen peroxide, respectively. kobs values of the first phase were plotted against the concentration of hydrogen peroxide.
