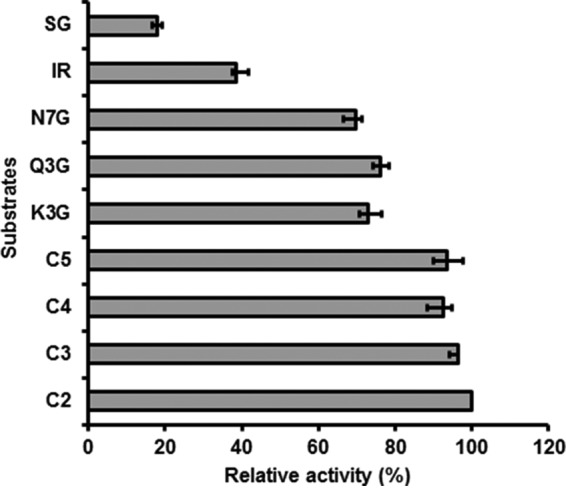
FIGURE 2.

Relative activity (%) of CsBGlu12 against a panel of substrates. Highest activity of cellobiose was taken as 100%, and activity of other compounds was calculated relative to the activity of cellobiose. C2, C3, C4, C5, Q3G, K3G, N7G, IR, and SG represent cellobiose, cellotriose, cellotetraose, cellopentose, quercetin 3-O-β-glucoside, kaempferol 3-O-β-glucoside, naringenin 7-O-β-glucoside, Iridin, and 1-O-sinopyl-β-glucose. All the values represent means of the three independent replicates ± S.D.
