FIGURE 7.
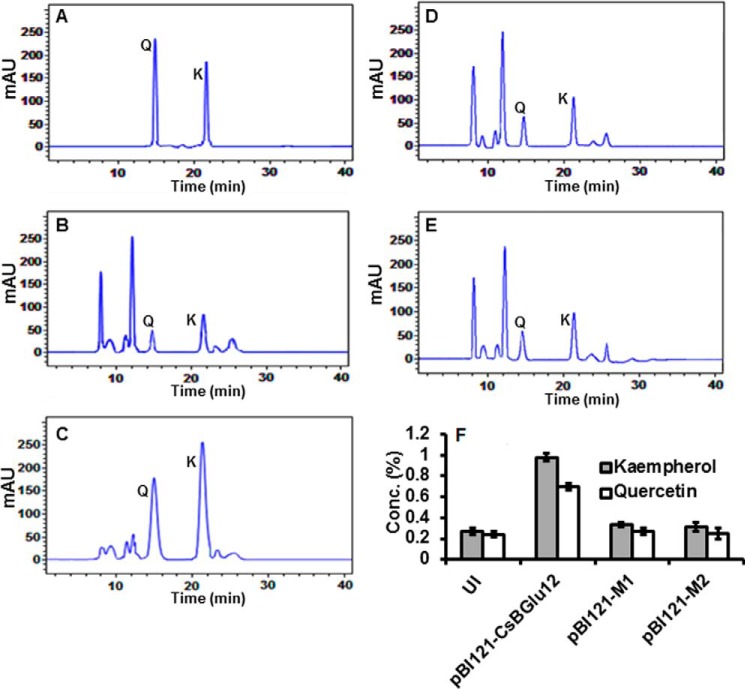
Quantification of flavonols (kaempferol and quercetin) by HPLC in uninoculated and transiently overexpressing N. benthamiana plants (pBI121-CsBGlu12, pBI121-M1, and pB121-M2). Chromatogram of reference compounds (A), uninoculated N. benthamiana (B), transiently overexpressing pBI121-CsBGlu12 plants (C), transiently overexpressing pBI121-M1 plants (D), transiently pBI121-M2 overexpressing plants (E), and quantification of flavonols in uninoculated (UI), pBI121-CsBGlu12, pBI121-M1 and pB121-M2 overexpressing plants (F). Q and K represent quercetin and kaempferol, respectively. All experiments were carried out in triplicate and expressed as mean ± S.D. mAU, milliabsorption units.

