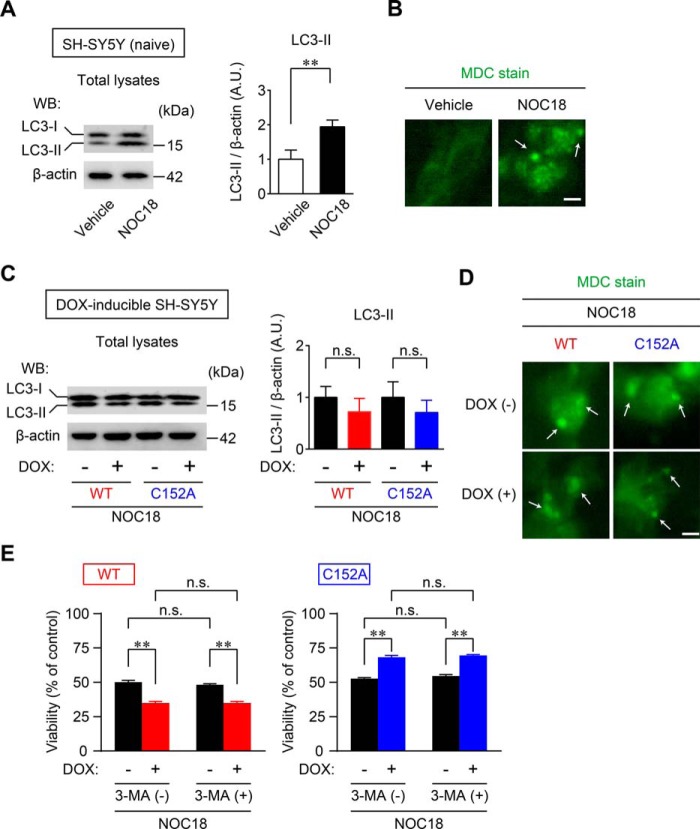
FIGURE 9.
Induction of autophagy is not affected by GAPDH aggregation. A, NOC18-induced autophagy was measured by the conversion of LC3-I (18 kDa) to LC3-II (16 kDa) as assessed by Western blotting (WB). The graph presents values calculated as the ratio of LC3-II band intensity to β-actin band intensity. Data are mean ± S.D. (n = 3). **, p < 0.01, relative to vehicle treatment, Student's t test. B, fluorescence of MDC staining of NOC18-treated SH-SY5Y cells. Arrows show punctate signals, indicating the induction of autophagy. Scale bar, 10 μm. C, effects of overexpression of WT- and C152A-GAPDH on the induction of autophagy with NOC18 treatment as evaluated by Western blotting. Data are mean ± S.D. (n = 3). D, fluorescence of MDC staining in DOX-inducible WT- and C152A-GAPDH-overexpressing SH-SY5Y cells with NOC18 treatment. Arrows show MDC-positive vesicles, indicating the induction of autophagy. Scale bar, 10 μm. E, effects of autophagy inhibitor 3-MA (1 mm) on the cell viability in WT (left graph)- or C152A (right graph)-GAPDH-overexpressing SH-SY5Y cells treated with NOC18 for 48 h. Data are mean ± S.D. (n = 4). **, p < 0.01, relative to DOX(−), Student's t test. A.U. indicates arbitrary units.

