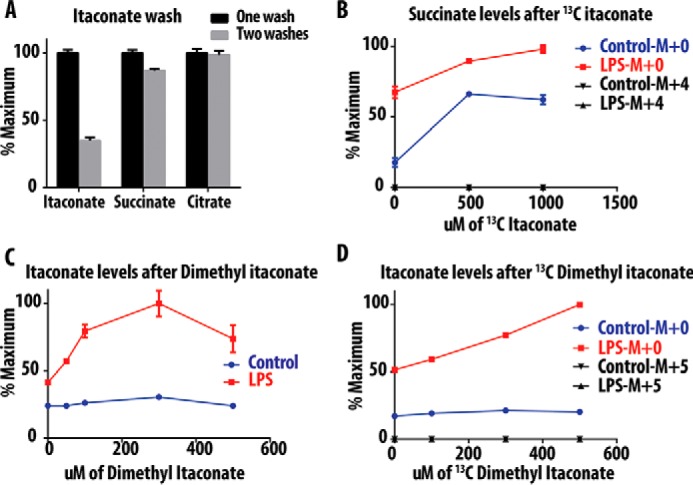
FIGURE 2.

Itaconate and succinate levels after treatment with dimethyl itaconate. A, levels of different metabolites in RAW cells after incubation with itaconic acid and subjecting plates to one or two wash steps. B, levels of succinate in mice BMDM after treatment with serial concentrations of [13C]itaconic acid. C, levels of itaconate in mice BMDM after treatment with serial concentration of DMI. D, levels of itaconate in mice BMDM after treatment with serial concentration of [13C]DMI. Data indicate S.E.
