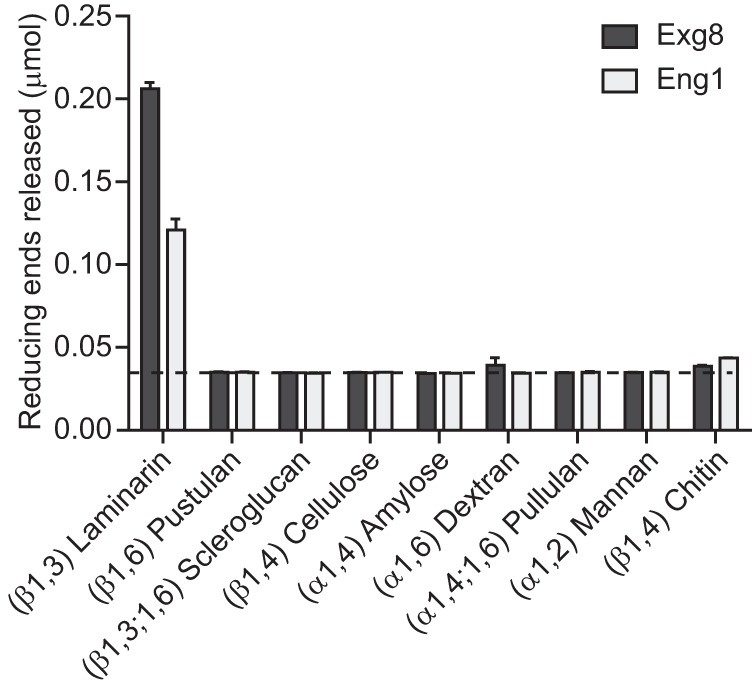
FIGURE 2.

Eng1 and Exg8 are glucanases specific for β1,3-glucosidic linkages. Glucan hydrolysis activity of purified Exg8 (dark bars) and Eng1 (light bars) is shown. Data represent the glucose or N-acetylglucosamine (for chitin substrate) equivalents (micromoles) of reducing sugars released after incubation of Eng1 or Exg8 with glycan substrates. Glycosidic linkages of the individual substrates are indicated in parentheses. Dashed line represents the limit of detection, and error bars represent the standard deviation among replicate reactions (n = 3).
