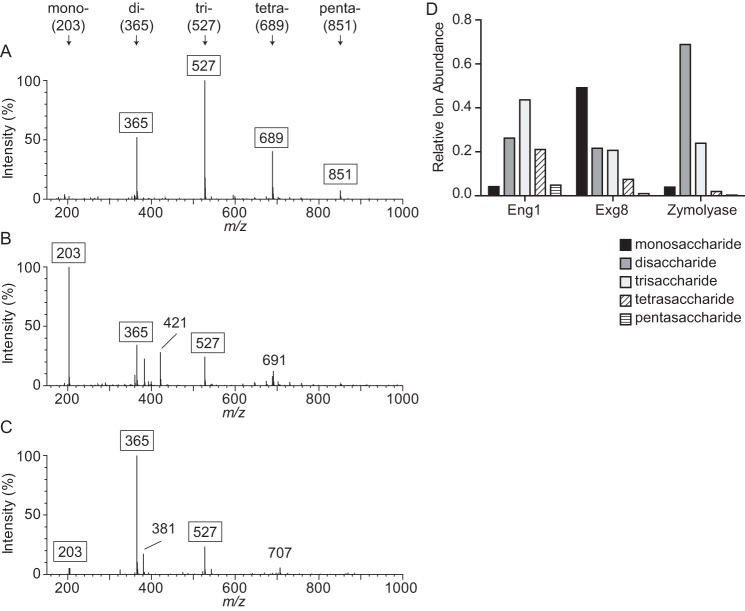
FIGURE 3.
Eng1 is an endoglucanase and Exg8 is an exoglucanase. Hydrolysis products of Eng1 and Exg8 activity on laminarin (β1,3-glucan) are shown. Laminarin was digested for 30 min with 30 ng of purified Eng1 (A), Exg8 (B), or the endo-β-glucanase zymolyase (C), and the products were detected by mass spectrometry. The relative ion intensities for ions between 150 and 1000 m/z are shown with peaks for monosaccharides (mono-, 203 m/z), disaccharides (di-, 365 m/z), trisaccharides (tri-, 527 m/z), tetrasaccharides (tetra-, 689 m/z), and pentasaccharides (penta-, 851 m/z) indicated with arrows. The m/z values for each saccharide peak represent sodiated glucose minus one water per each additional glucose unit. D, relative ion intensities for singly charged monosaccharide through pentasaccharide peaks. Data shown are representative of three independent experiments.

