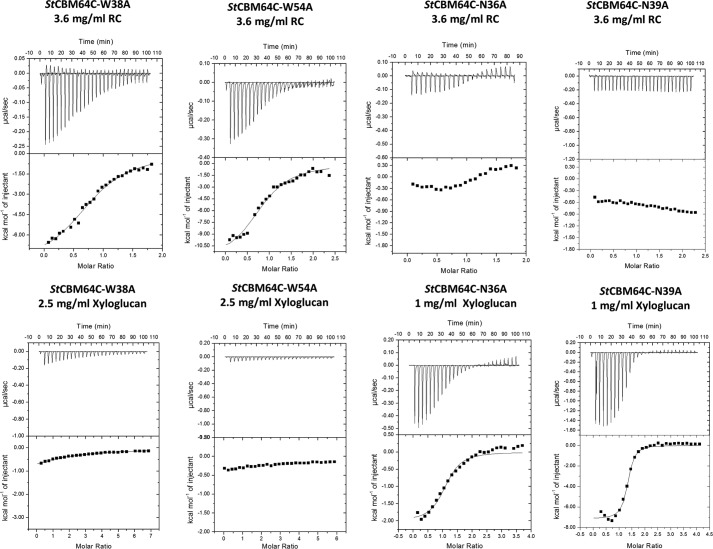
FIGURE 8.
Representative ITC data of the interaction of mutant derivatives of StCBM64C with RC and xyloglucan. Titrations were conducted as described in the legend to Fig. 7. The top portion of each panel shows the raw power data, whereas the bottom panel shows the integrated and heat of dilution corrected data.

