
FIGURE 6.
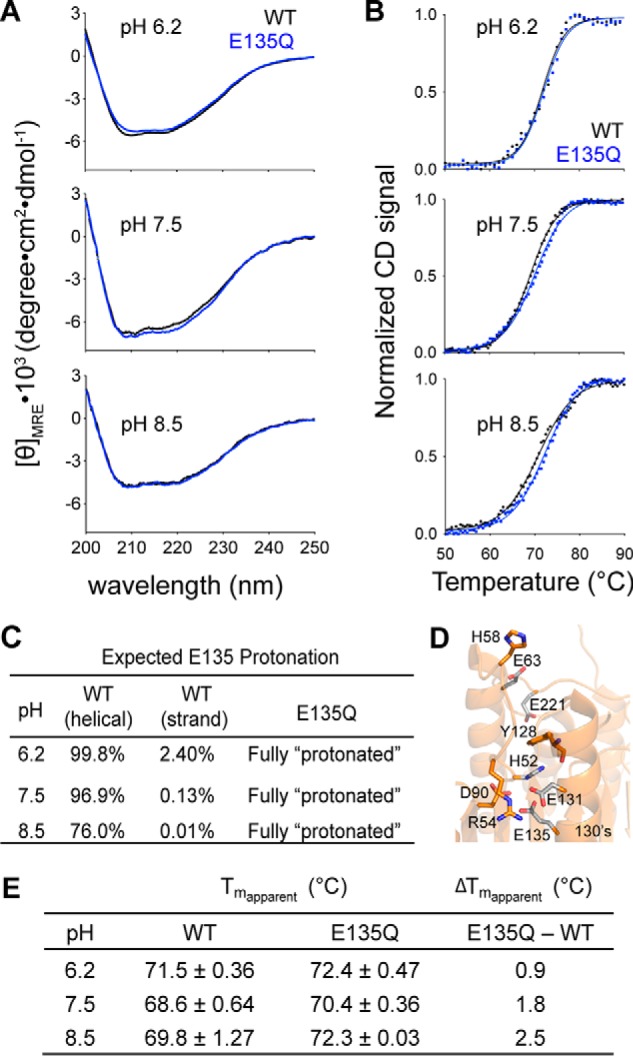
The stabilizing effect of constantly protonated E135Q variant is more pronounced at higher pH. A, the CD spectra of caspase-6 WT (black line) and the E135Q variant (blue line) measured at different pH levels. B, CD thermal denaturation profiles of caspase-6 WT (black dotted line) and E135Q (blue dotted line) at the indicated pH levels. Normalization of the CD signal was achieved by setting the highest and the lowest values for each data set as 100 and 0%, respectively. The thermal denaturation data were then fitted to the Boltzmann sigmoidal equation (black solid line in WT and blue solid line in E135Q), where the midpoint of the curve was determined to be the apparent Tm. C, the expected percentage protonation of Glu-135 at different pH was determined based on the calculated pKa values in Fig. 4B following the Henderson-Hasselbalch equation. D, interactions between Glu-135 and adjacent residues that impact the helix-strand interconversion. E, the individual apparent Tm values and the differences in the apparent Tm values of caspase-6 WT and E135Q at different pH are tabulated. The apparent Tm values are reported as mean ± S.D. of duplicate measurements on two independently prepared samples performed on two different days.