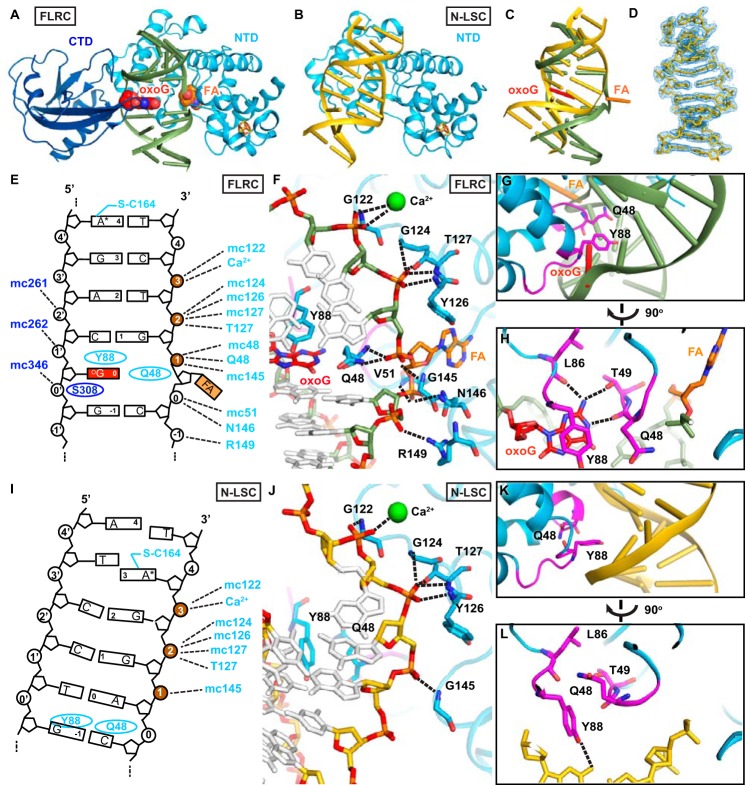
FIGURE 2.
Structures of the N-LSC and the 2′-FLRC. A, structure of the FLRC (PDB code 3G0Q) showing 2′-flouroadenosine (FA) in the active site. The NTD of MutY is colored in cyan, the C-terminal domain is in blue, and the iron-sulfur cluster is in orange (iron) and yellow (sulfur) sticks. The DNA backbone is colored green, and the oxoG and FA are in red (oxoG) and orange (2′-flouroadenosine) spheres. B, structure of the N-LSC (present work) showing the NTD scanning along undamaged DNA. The color scheme is the same as in A except that DNA backbone is colored gold. C, global changes in DNA structure. The MutY NTD in the N-LSC and the FLRC are superimposed. The protein is not displayed, but the DNA that is bound to it is. D, structure of the DNA in the N-LSC. The blue mesh is σA-weighted 2mFo − DFc map contoured at 1σ. E and I, schematic diagrams showing the protein-DNA interactions in the FLRC and the N-LSC, respectively. The phosphate groups that the protein contacts in both structures are colored brown. F and J, views of the target strand in the FLRC and N-LSC. The dotted lines indicate the contacts between MutY and the DNA backbone. G and K, close-up views of the DNA minor groove interactions by MutY in FLRC and N-LSC. The two short loops that intercalate the DNA in the FLRC are shown in magenta. H and L, FLRC and the N-LSC structures rotated 90° from panels G and K views, respectively.

