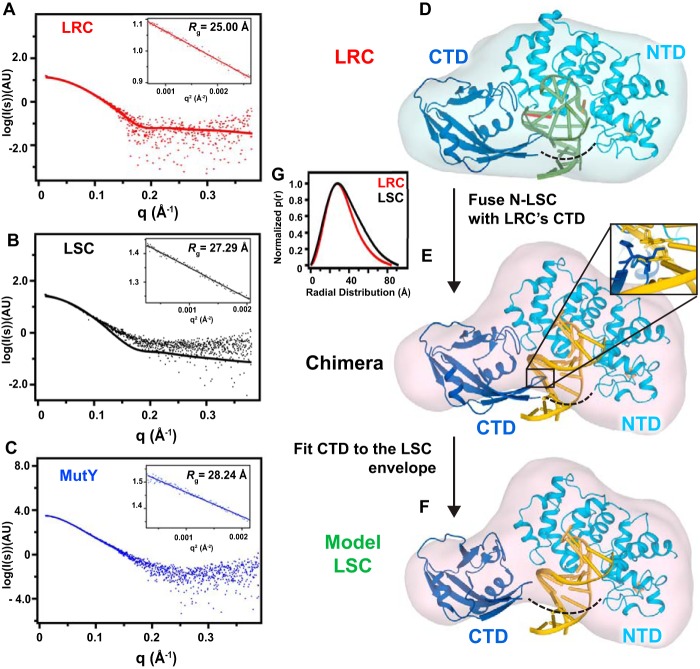
FIGURE 5.
SAXS curves and low resolution envelopes of MutY-DNA complexes. A, experimental SAXS data (I(q) verses q) of the LRC shown as red dots. The theoretical scattering curve of the LRC (PDB code 1RRQ) is shown in red line. The inset shows the Guinier plot for LRC. B, experimental SAXS data of the LSC shown as black dots. The black line is the theoretical scattering curve (generated by CRYSOL; see “Experimental Procedures” for method details) of the chimera shown in E. The inset shows the Guinier plot for LSC. C, experimental SAXS data of MutY shown as blue dots. The inset shows the Guinier plot. D, superposition of the LRC crystal structure to the ab initio envelope (see “Experimental Procedures” for detailed protocols in SAXS data analysis). E, superposition of the chimera structure to the ab initio envelope of the LSC. The chimera was made by superimposing the LRC sthat of the N-LSC and fusing the CTD of LRC to the N-LSC. The inset shows the steric clash of the CTD with the DNA in N-LSC. F, superposition of the model LSC to the ab initio envelope of LSC. G, the p(r) function of the SAXS data of the two complexes.

