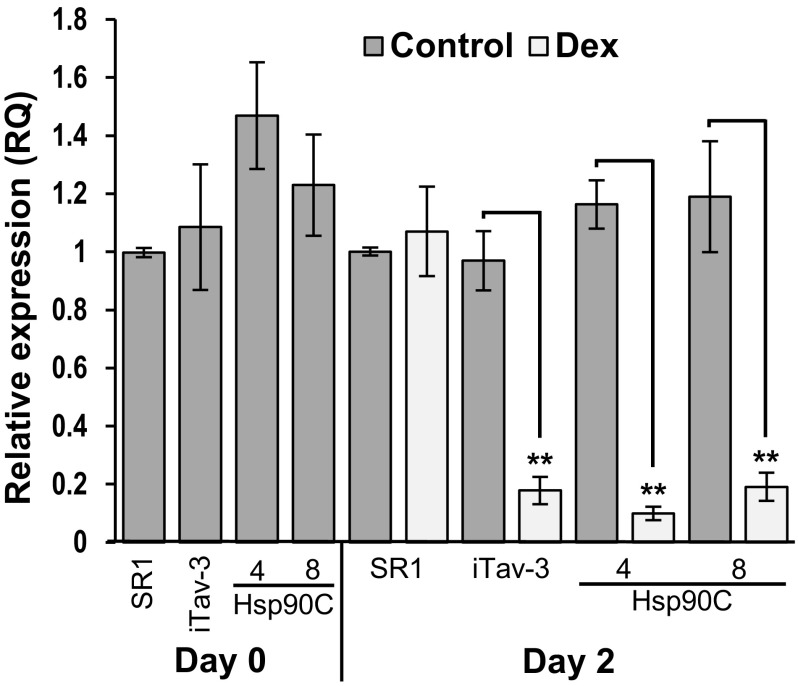
Fig. 3.
Quantitative RT-PCR analysis of Hsp90C gene expression. Non-transformed control (SR1), and three transgenic lines, iTav-3, Hsp90C-4, and -8 (see the legend for Fig. 2 for abbreviation) were analyzed for Hsp90C gene expression before (Day 0), 2 dpt with Dex (Day 2) by qRT-PCR in triplicate. The mean values of relative expression to untreated SR1 plants and their standard deviations are shown. The double asterisks show statistically significant difference between mock- and Dex-treated plants in Student t test (p < 0.01)

