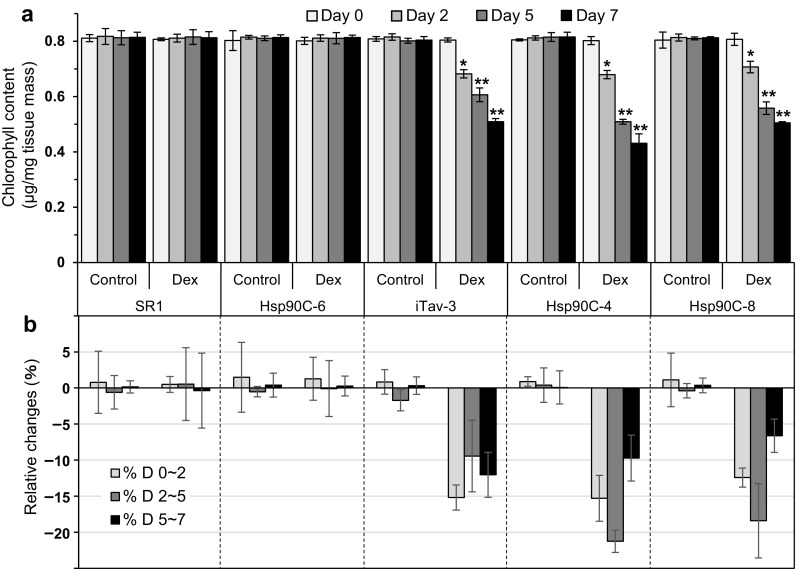
Fig. 5.

Decrease in total chlorophyll content during the progression of induced chlorosis. Three-week-old plants were mock- (Control) or Dex-treated (Dex) as in Fig. 4. Triplicate samples were collected from independent plants before (Day 0), and 2, 5, and 7 days of treatments (Day 2, Day 5 and Day 7, respectively) and chlorophyll content was measured in each of them. a Means of chlorophyll content in triplicate samples and standard deviations of the mean values are shown. Single and double asterisks indicate statistically significant difference between mock- and Dex-treated samples with p < 0.05 and p < 0.01, respectively in Student’s t-test. b Changes in chlorophyll content during early (from Day 0 to 2; % D 0–2), middle (from Day 2 to 5; % D 2–5), and late phases (from Day 5 to 7; % D 5–7) are shown in percentages to the mean values of Day 0 chlorophyll content with their standard deviations
