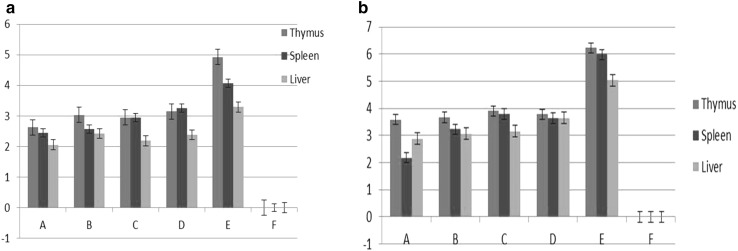
Fig. 1.
Absolute viral load quantitation of CIAV in thymus, spleen and liver tissues by qRT-PCR, a viral load represented as mean CIAV copy number log10/g in different tissues at 7th DPI, b viral load represented as mean CIAV copy number log10/g in different tissues at 14th DPI. (Treatment groups: A W. somnnifera, B T. cordifolia, C A. indicduta, D E care Se Herbal, E Positive control, F Negative control)

