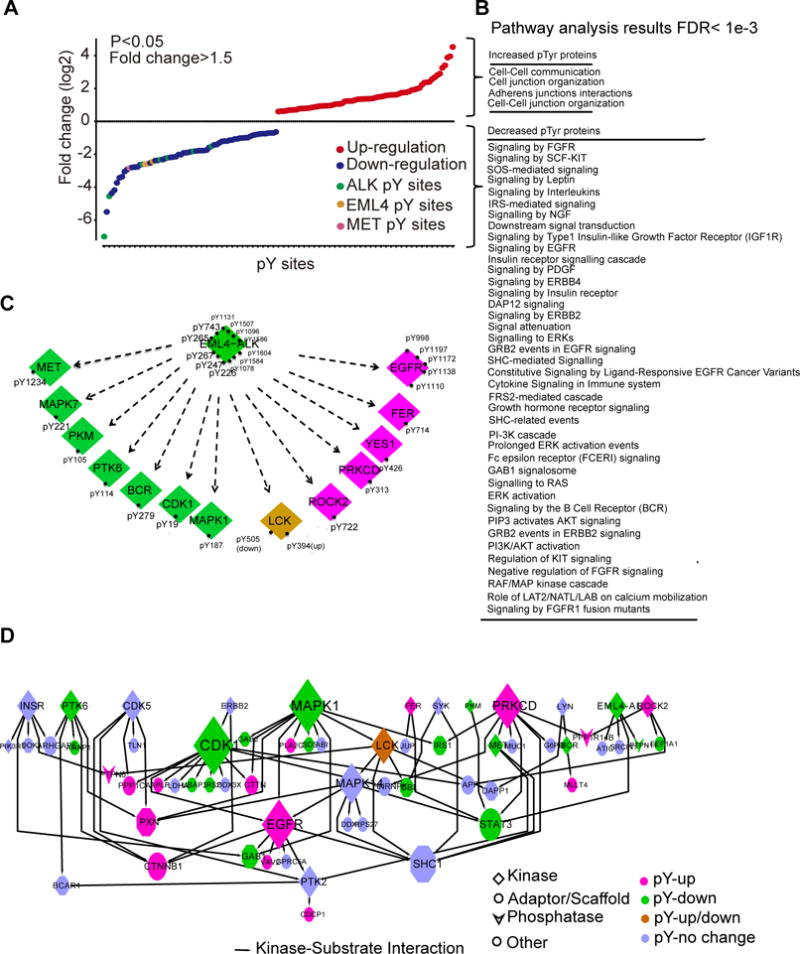
Figure 3. Phosphoproteomics characterizes the response of H3122 cells to crizotinib.

(A) Fold-change in the abundance of tyrosine-phosphorylated (pTyr) peptides in H3122 cells treated with crizotinib (1 μM, 3 hours), relative to those treated with DMSO, was quantified using label-free, peak area. Data are representative of a single experiment with biological replicates for DMSO, crizotinib 100 nM, and crizotinib 1000 nM treated samples with each run in a technical replicate. A two-sample t-test was performed to compare differential phosphorylation for each tyrosine between the control and treatment group treated at 1000 nM (B) Pathways in which crizotinib increased or decreased the Tyr-phosphorylation of proteins found in (A) in H3122 cells (A). (C) Kinases and pTyr sites regulated by crizotinib in cells described in (A). (D) Kinase-substrate interactions among pTyr proteins identified in (A) was extracted from PhosphositePlus (http://www.phosphosite.org/homeAction.action), with the node size representing the number of substrates, and colors representing changes by crizotinib.
