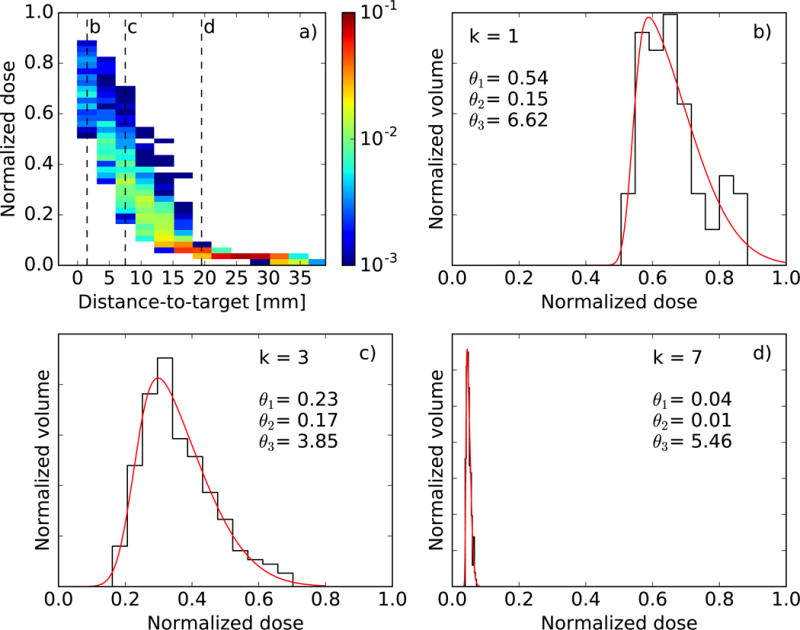
Figure 1.

(a) 2D histogram of dose versus distance-to-target for a single brainstem structure. Color indicates the fractional volume. (b–d) Skew-normal fits (red) to the dose distribution (black) found in three different subvolumes, indicated by the dashed lines in (a). Maximum-likelihood parameter estimates are also displayed. Dose is normalized to the mean target dose.
