
Figure 4.
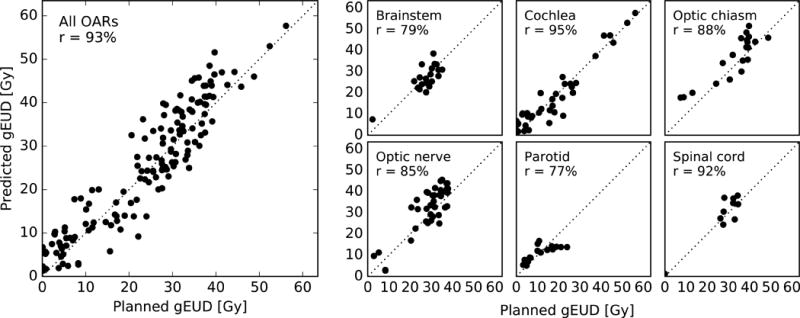
Predicted gEUD versus planned gEUD for every OAR structure in the validation cohort (left) and a breakdown by OAR type (right). Pearson’s r is also shown.
Official websites use .gov
A
.gov website belongs to an official
government organization in the United States.
Secure .gov websites use HTTPS
A lock (
) or https:// means you've safely
connected to the .gov website. Share sensitive
information only on official, secure websites.
Predicted gEUD versus planned gEUD for every OAR structure in the validation cohort (left) and a breakdown by OAR type (right). Pearson’s r is also shown.