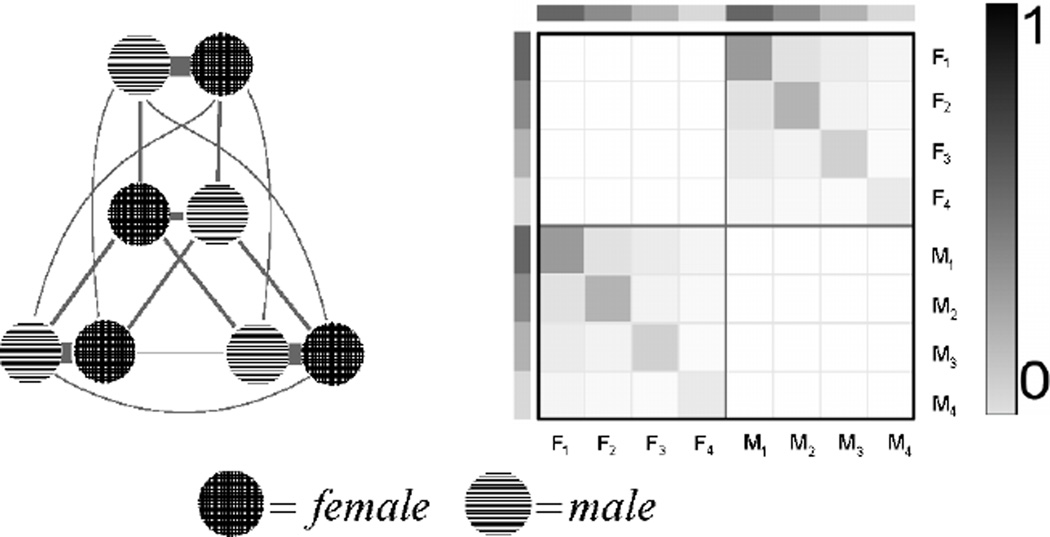
Figure 3.
Mixing diagram (left) and the block matrix (right) for our bipartite, degree-corrected, stochastic block model. On the mixing diagram, line thickness represents the proportion of edges (connections) between each block. For the block matrix, F1 – F4 represent the four female blocks, and M1 – M4 represent the four male blocks, and the shading represents the propensity to mix (form connections) within or across blocks.

