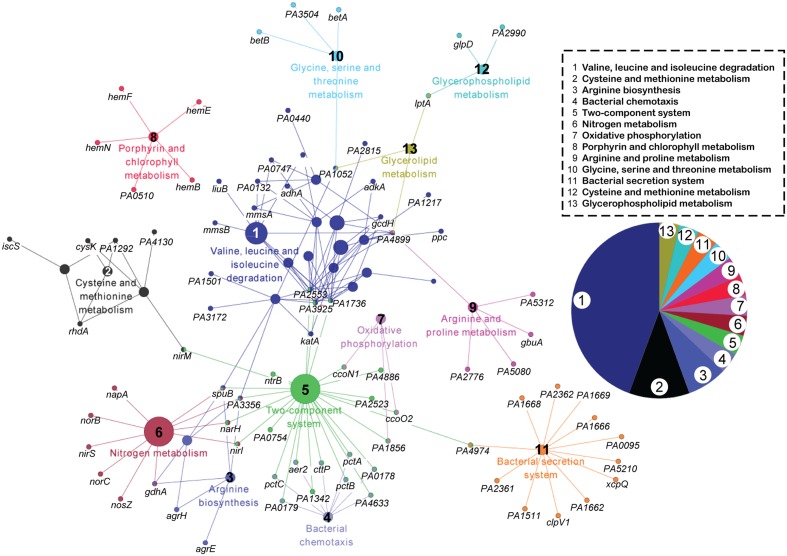
FIGURE 2.
KEGG pathway network analysis of downregulated genes (p < 0.05) in phage-infected PA1. The functionally grouped network was visualized using Cytoscape based on the degree of connectivity (node size) between pathways and genes (nodes). The 349 downregulated genes at the three time points were involved in 13 pathways, which are distinguished by different colors and numbered 1 to 13. The pie chart displays the corresponding pathways.

