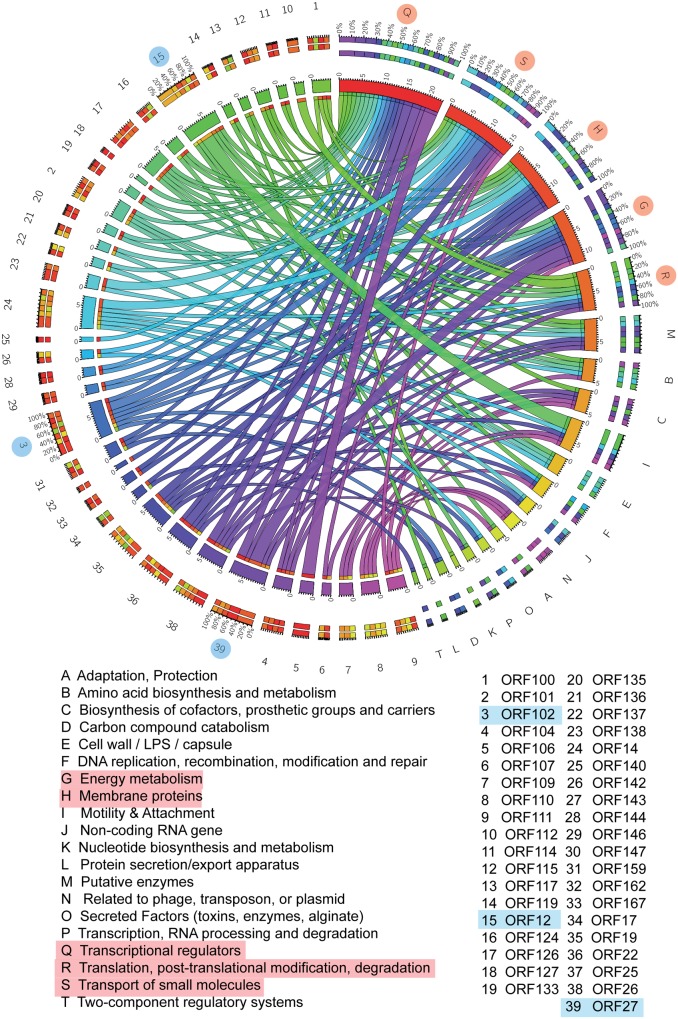
FIGURE 3.
Gene interaction network between PaP1 and host PA1. PseudoCAP function analysis of PA1 genes in the gene–gene network. The circos plot, which consists of 20 PseudoCAP functions of the host and 39 phage genes, was constructed based on the gene co-expression network. The PseudoCAP functions are shown with different colors, and the relative size of the links indicates the number of host genes in each functional term; wider links indicate more host genes in that term. The color box for phage genes (the outermost ring) indicates the functional composition of their host gene partners.

