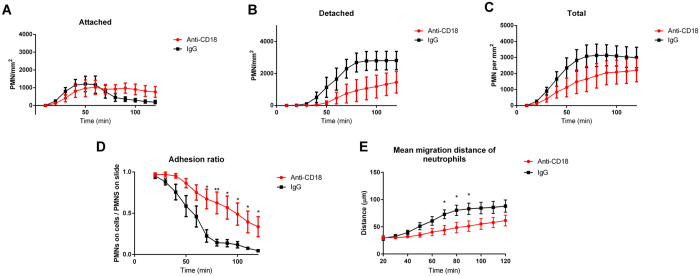
Figure 6. Time profile of neutrophil migration quantity across T84, measured by μOCT, anti-CD18 treated vs. IgG1 control.
(A) Migration density of neutrophils detected within approximately 60 μm of epithelium. (B) Migration density of neutrophils detected not within 60 μm of epithelium. (C) Total migration density of neutrophils. (D) Ratio of neutrophils detected within 60 μm of epithelium to total neutrophils detected. E: Mean migration distance of neutrophils. All panels: Time points with significant differences between treatments denoted by *(p < 0.05) or **(p < 0.01).

