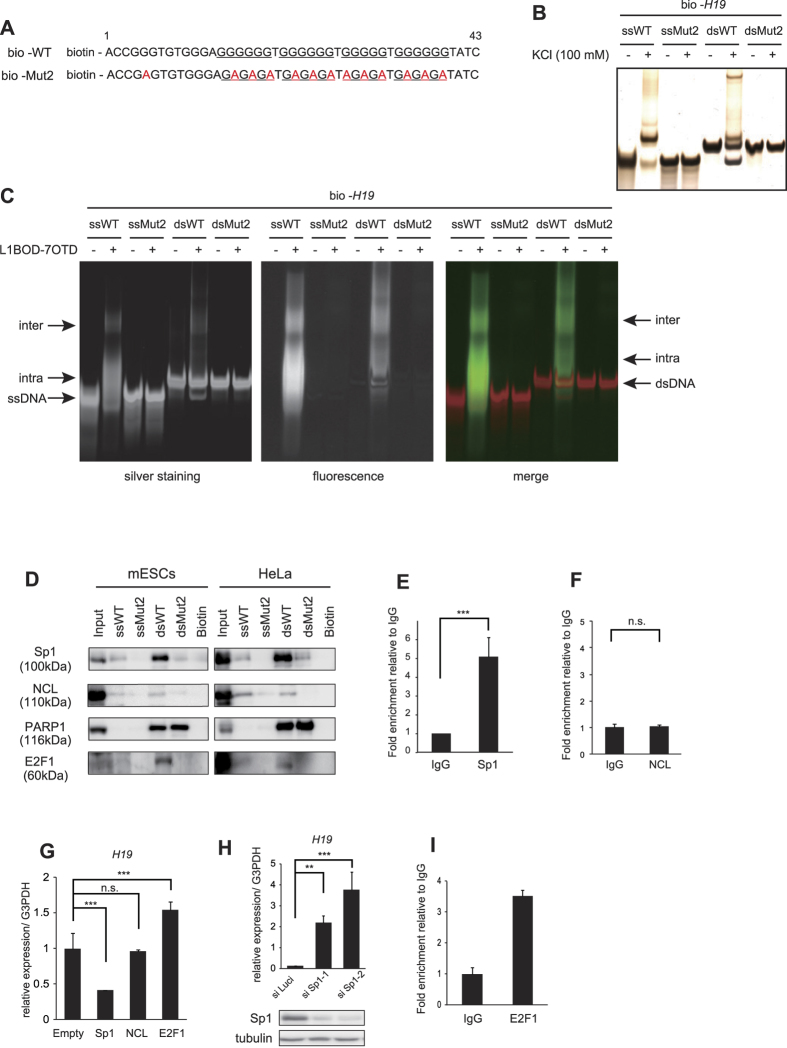
Figure 5. Identification of H19 G-quadruplex associated factors.
(A) Biotin-labeled oligonucleotide sequences used in the pull-down assays. (B) Single-stranded (ss) or double-stranded (ds) biotin-labeled oligonucleotides in (A) were prepared by heating at 95 °C for 5 min, followed by cooling to 4 °C. The oligonucleotides were incubated with or without 100 mM KCl, electrophoresed, and subjected to silver staining. (C) Each oligonucleotide prepared as in (B) was incubated with or without L1BOD-7OTD, and electrophoresed. Silver stained images and fluorescent signals are shown. (D) Western blot analysis of Sp1, NCL, PARP1 and E2F1 for the pull-down assay of each oligonucleotide. The input is 10% of the total fraction used for each sample. Uncropped images are in Supplementary Figure 6A. (E,F) ChIP-qPCR analysis against Sp1 (E), NCL (F) or control IgG in HeLa cells by using primer pairs for amplifying the region between +113 and +282. The obtained qPCR values are normalized by input DNA. Fold enrichment relative to IgG is shown. (G) qPCR analysis for endogenous H19 RNA levels in HeLa cells transiently expressing Sp1, NCL and E2F1. Values are normalized against G3PDH. (H) qPCR analysis for endogenous H19 RNA levels in HeLa cells depleted with Sp1 by siRNA. Western blot analysis of Sp1 and control tubulin are shown in the bottom. Uncropped images are in Supplementary Figure 6B. (I) ChIP-qPCR analysis against E2F1 or control IgG in HeLa cells ectopically expressing E2F1. The obtained qPCR values are normalized by input DNA. Fold enrichment relative to IgG is shown. (E–I) mean ± s.d. from three (E–H) or two (I) independent experiments; **P < 0.01, ***P < 0.005 analyzed by two-tailed t-test (E,F) or Dunnett’s multiple-comparison test (G,H).

