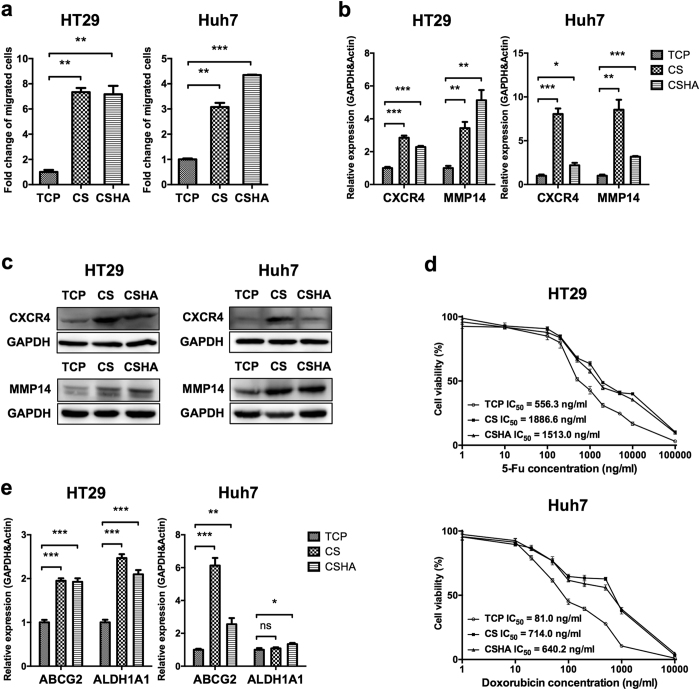
Figure 2. Analysis of cell motility and drug resistance and associated gene expressions.
(a) The migrated cell numbers were quantified by the transwell migration assay and normalized to the TCP group. (b) CXCR4 and MMP14 mRNA expressions after 72 hrs of culture. (c) The protein expression level of CXCR4 and MMP14 after 72 hrs of culture. (d) Cell viability after treatments with varying concentrations of 5-Fu (1, 10, 100, 200, 500, 1,000, 2,000, 5,000, 10,000, and 100,000 ng/mL) and doxorubicin (1, 10, 20, 50, 100, 200, 500, 1,000, and 10,000 ng/mL) for HT29 and Huh7, repectively. Each point represents the means of six determinations (n = 6). (e) The mRNA expression levels of ABCG2 and ALDH1A1 after 72 hrs of culture. Each bar represents the means of three determinations ± SD. *p < 0.05, **p < 0.01, ***p < 0.001 among the indicated groups.

