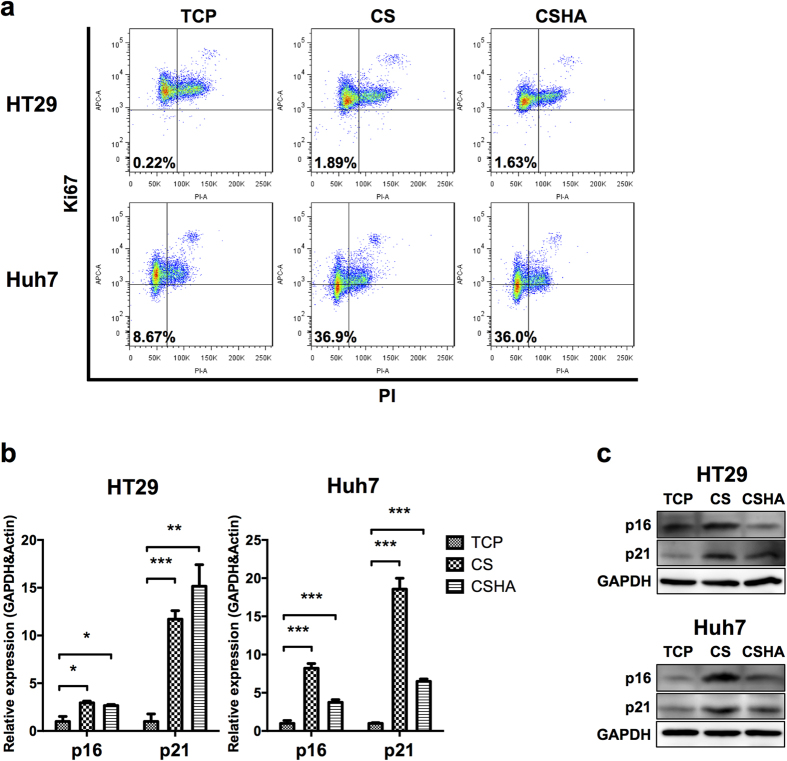
Figure 5. Characterization of quiescent population for HT29 and Huh7.
(a) Ki-67 and PI negative population representing the quiescent population. (b) p16 and p21 mRNA expressions after 72 hrs of culture. (c) The protein expression levels of p16 and p21 after 72 hrs of culture. Each bar represents the means of three determinations ± SD. *p < 0.05, **p < 0.01, ***p < 0.001 among the indicated groups.

