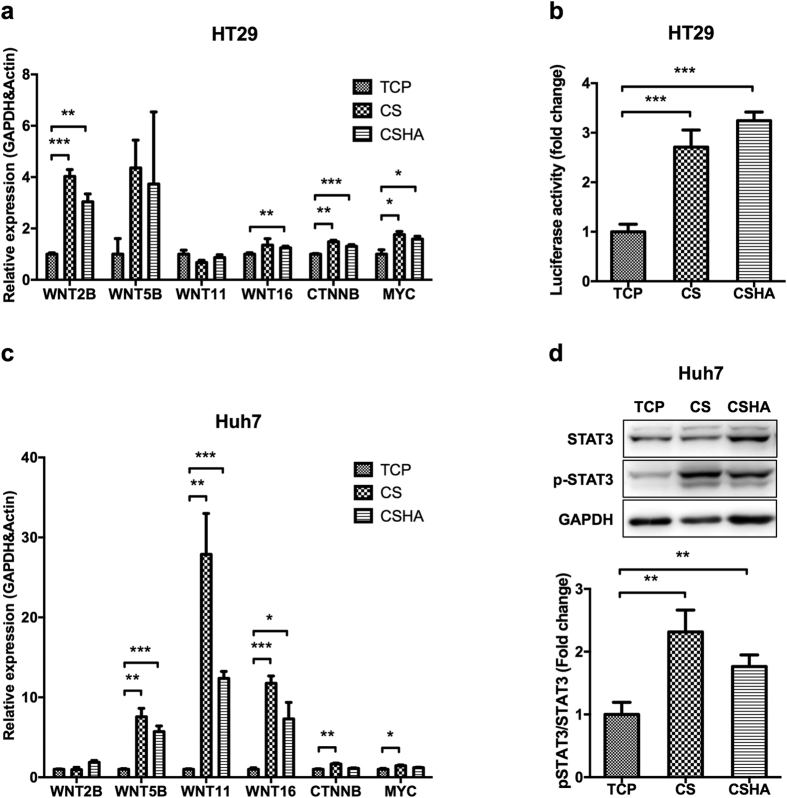
Figure 6. Activation of canonical and noncanonical Wnt signaling pathways for cancer cells on CS and CSHA membranes.
(a) The mRNA expression levels of WNT2B, WNT5B, WNT11, WNT16, CTNNB, and MYC in HT29 after 72 hrs of culture. (b) TOP-flash luciferase reporter assay showed the activation of canonical Wnt signaling in HT29 grown on CS and CSHA membranes. (c) The mRNA expression levels of WNT2B, WNT5B, WNT11, WNT16, CTNNB, and MYC in Huh7 after 72 hrs of culture. (d) Phosphorylation of STAT3 by western blot for Huh7 on CS and CSHA membranes after 72 hrs of culture. The lower bar chart indicated the quantification of protein band. Each bar represents the means of three determinations ± SD. *p < 0.05, **p < 0.01, ***p < 0.001 among the indicated group.

