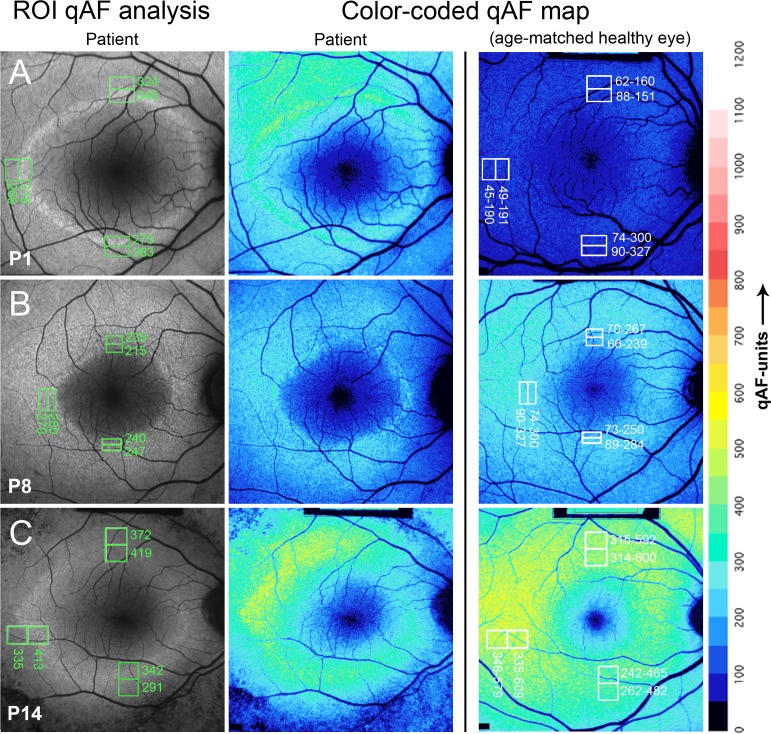
Figure 3.
Representative SW-AF images of RP patients P1, P8, and P14. Short-wavelength fundus autofluorescence images are presented together with the positions of ROI rectangles and corresponding qAF values (column 1); color-coded maps of qAF in patients with RP (column 2); and color-coded maps of qAF of age-similar healthy eyes (column 3). Color scale of qAF units (0–1200) is provided on the right margin. P1 (A) represents a characteristic SW-AF ring with ROI-qAF being outside the 95% CI of healthy individuals. P8 (B) and P14 (C) show examples of patients with ROI-qAF values within the 95% CI.

